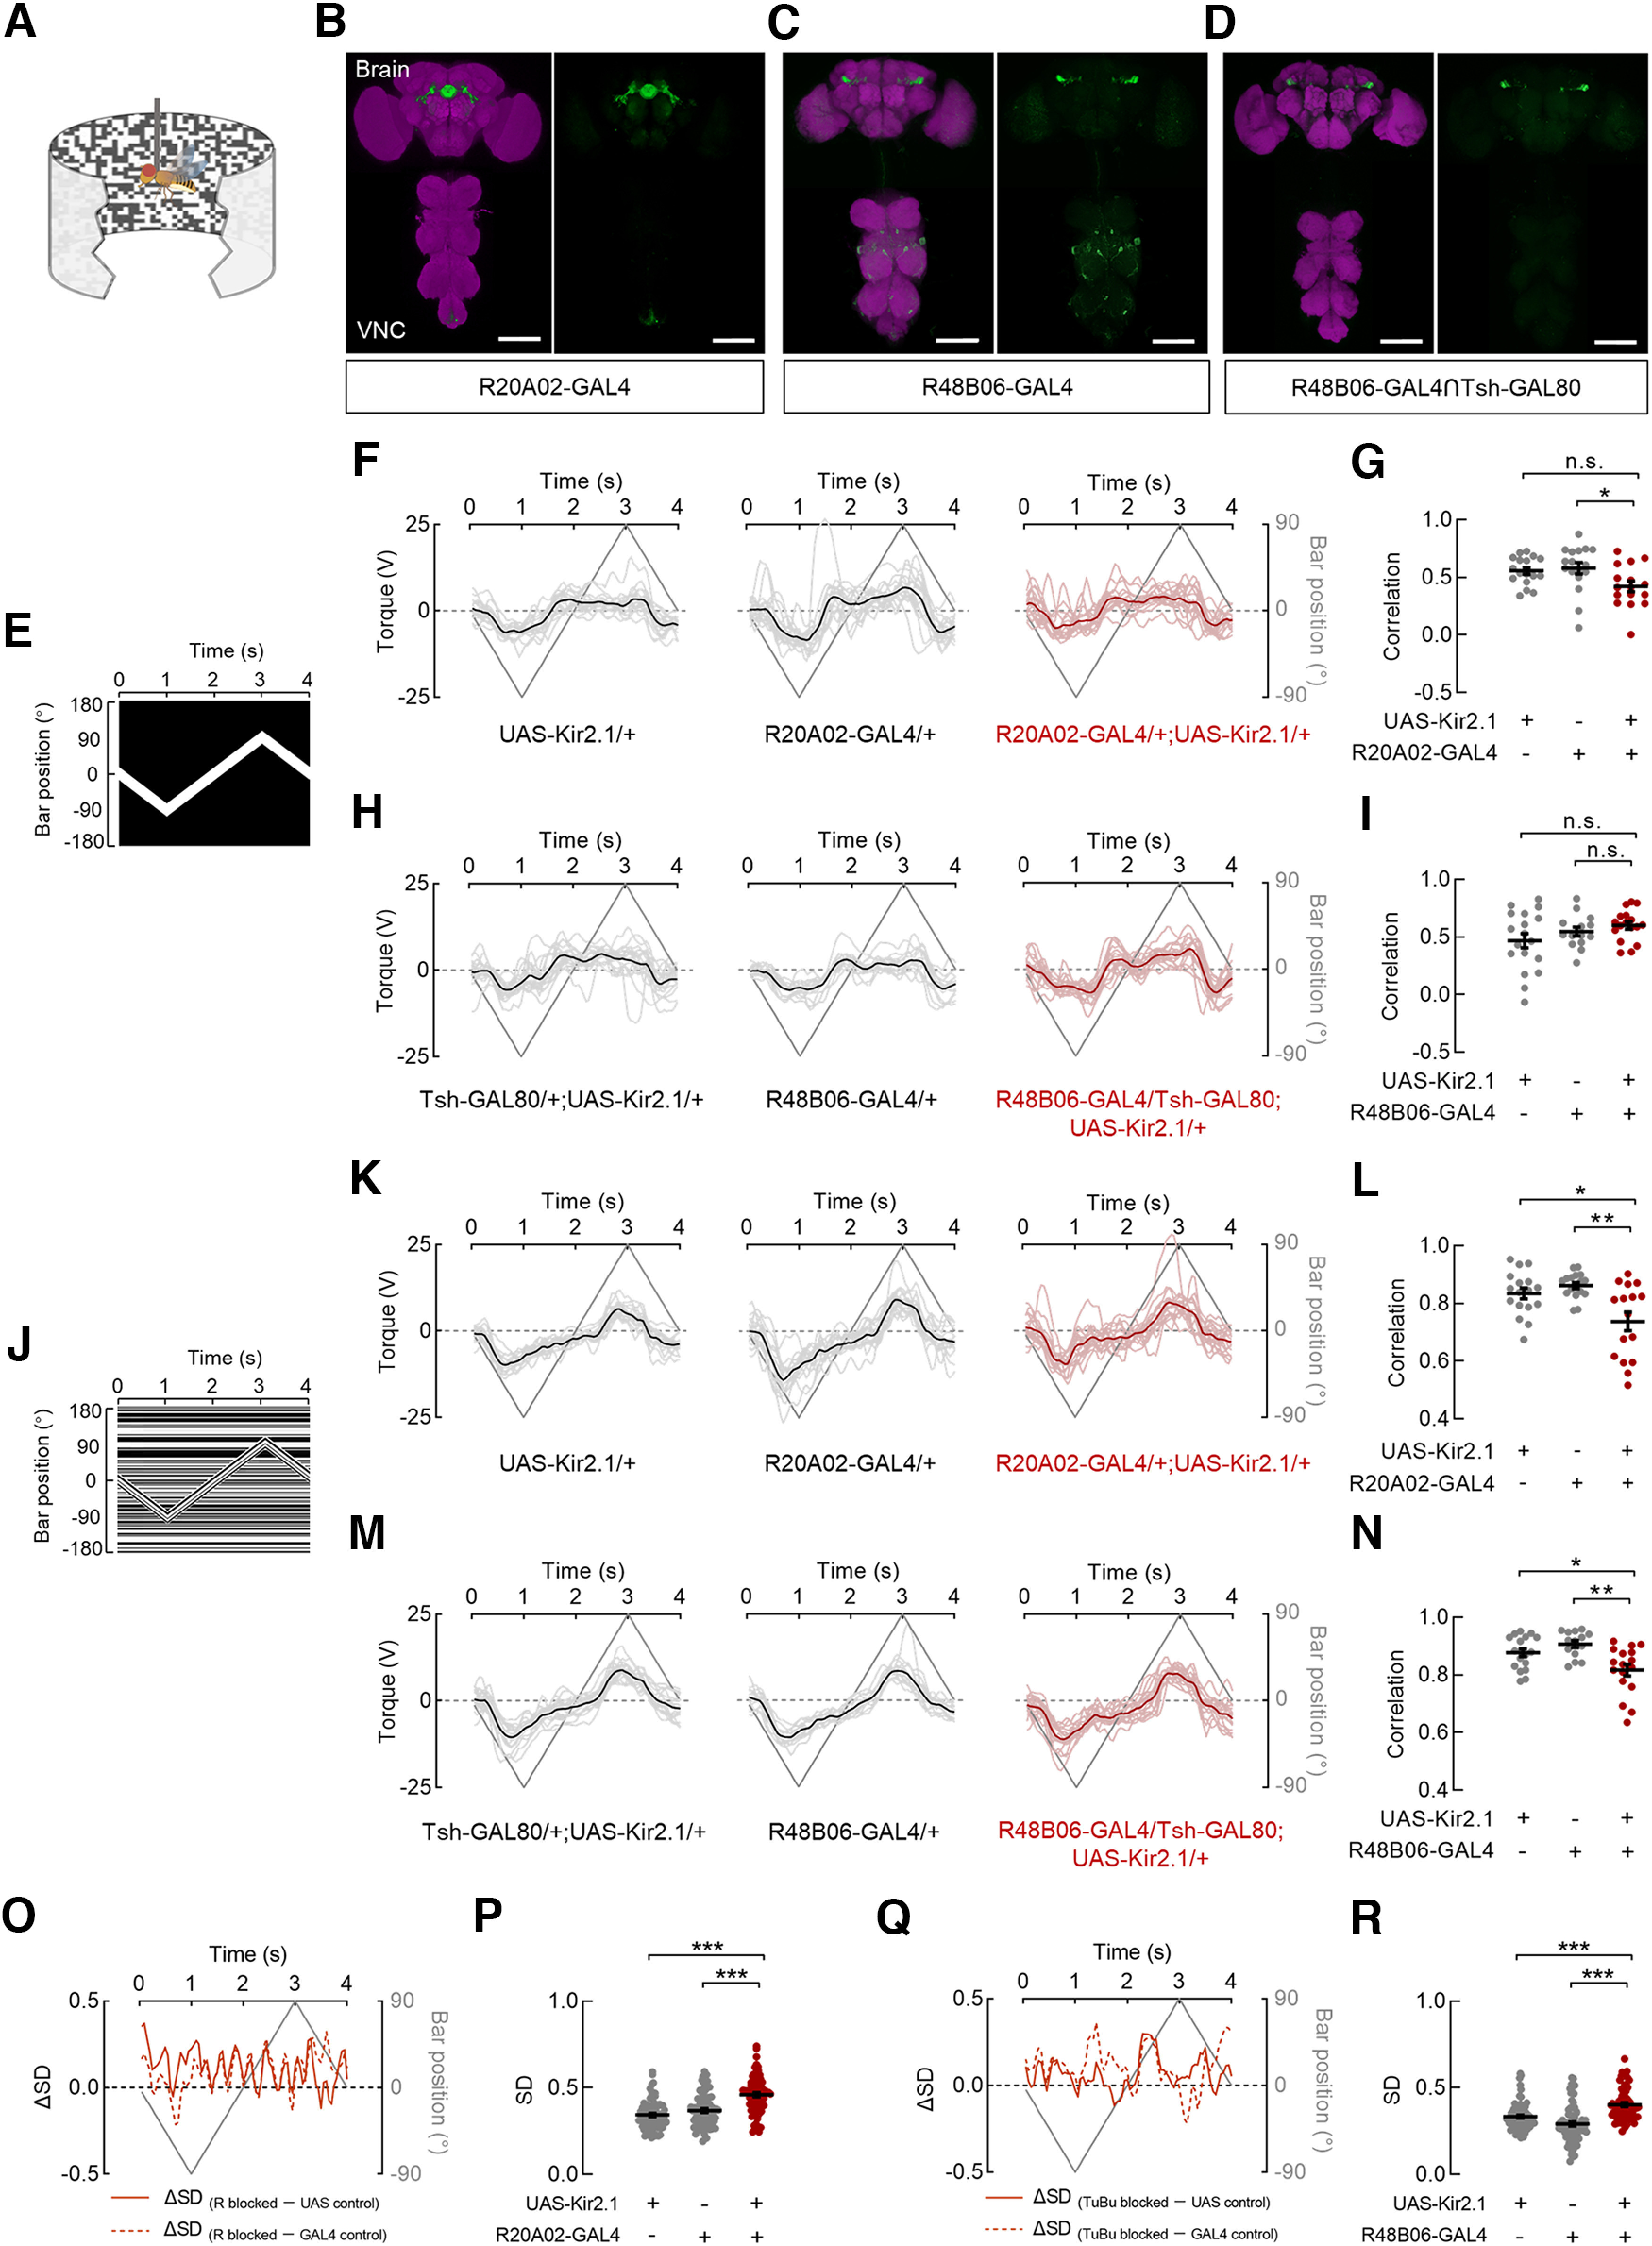
Figure 6.

Ring and tuberculo-bulbar neurons are involved in the tracking response toward a motion-defined bar. A, Schematic diagram of the flight simulator. A rigid-tethered fly was surrounded by a panoramic arena. B–D, Anatomy of neurons in the brain and VNC that were labeled by distinct GAL4 lines driving the expression of UAS-Kir2.1::GFP. The following driver lines were used: R20A02-GAL4 (B), R48B06-GAL4 (C), and R48B06-GAL4∩Tsh-GAL80 (D). Neuropil was immunostained with anti-Bruchpilot (magenta). Scale bars, 100 μm. E, The space–time plot for a 30° × 90° luminance-defined bar. The bar started at the center (0°) of the arena and oscillated between ± 90° at 90°/s. F, Steering trajectories of R-blocked flies and both parental control flies in response to the luminance-defined bar. UAS-Kir2.1/+ (left), n = 17 flies; R20A02-GAL4/+ (middle), n = 17 flies; R20A02-GAL4/+; UAS-Kir2.1/+ (right), n = 16 flies. Lines in deep gray indicate the bar position. Lines in black or deep red represent the mean responses of all flies. An individual line in gray or light red represents the trial-averaged response from a single fly. G, The correlations between steering trajectories and bar positions for all flies in F. The correlations in R-blocked flies were significantly different from those in the GAL4 control but not in the UAS control. Kruskal–Wallis test with Dunn's multiple comparisons test, H = 7.99, p = 0.0184. GAL4 control versus blocked flies, p = 0.0183; UAS control versus blocked flies, p = 0.1363. Black lines indicate mean ± SEM across flies. H, Steering trajectories of TuBu-blocked flies and both parental control flies in response to the luminance-defined bar. Tsh-GAL80/+; UAS-Kir2.1/+, n = 18 flies; R48B06-GAL4/+; UAS-Kir2.1/+, n = 14 flies; R48B06-GAL4/Tsh-GAL80; UAS-Kir2.1/+, n = 17 flies. I, The correlations between steering trajectories and bar positions for all flies in H. The correlations in TuBu-blocked flies were not significantly different from those in both parental control flies. Brown–Forsythe ANOVA with Tamhane's test, F(2,36.1) = 2.221, p = 0.1231. GAL4 control versus blocked flies, p = 0.6686; UAS control versus blocked flies, p = 0.1937. J, The space–time plot for a 30° × 90° motion-defined bar. The bar started at the center (0°) of the arena and oscillated between ± 90° at 90°/s. K, Steering trajectories of R-blocked flies and both parental control flies in response to the motion-defined bar. UAS-Kir2.1/+, n = 17 flies; R20A02-GAL4/+, n = 17 flies; R20A02-GAL4/+; UAS-Kir2.1/+, n = 16 flies. L, The correlations between steering trajectories and bar positions for all flies in K. The correlations in R-blocked flies were significantly lower than those in both parental control flies. Brown–Forsythe ANOVA with Tamhane's test, F(2,28.08) = 8.478, p = 0.0013. GAL4 control versus blocked flies, p = 0.0054; UAS control versus blocked flies, p = 0.0458. M, Steering trajectories of TuBu-blocked flies and both parental control flies in response to the motion-defined bar. Tsh-GAL80/+; UAS-Kir2.1/+, n = 18 flies; R48B06-GAL4/+; UAS-Kir2.1/+, n = 14 flies; R48B06-GAL4/Tsh-GAL80; UAS-Kir2.1/+, n = 17 flies. N, The correlations between steering trajectories and bar positions for all flies in M. The correlations in TuBu-blocked flies were significantly lower than those in both parental control flies. One-way ANOVA with Tukey's test, F(2,46) = 7.802, p = 0.0012. GAL4 control versus blocked flies, p = 0.0011; UAS control versus blocked flies, p = 0.0249. O, The differences in the SD of steering trajectories between R-blocked flies and both control flies (solid line, UAS control; dotted line, GAL4 control) throughout the duration when a motion-defined bar was presented. Values > 0 represent the time intervals in which the steering trajectories in R-blocked flies had larger SDs compared with control groups. P, Comparisons of SDs between R-blocked flies and both parental control flies. The SDs in R-blocked flies were significantly larger than those in control flies; n = 80 data points in each group. Kruskal–Wallis test with Dunn's multiple comparisons test, H = 51.14, p < 0.0001. GAL4 control versus blocked flies, p < 0.0001; UAS control versus blocked flies, p < 0.0001. Q, The differences in the SD of steering trajectories between TuBu-blocked flies and both control flies throughout the duration when a motion-defined bar was presented. Values > 0 represent the time intervals in which the steering trajectories in TuBu-blocked flies had larger SDs compared with control groups. R, Comparisons of SDs between TuBu-blocked flies and both parental control flies. The SDs in TuBu-blocked flies were significantly larger than those in control flies; n = 80 data points in each group. Kruskal–Wallis test with Dunn's multiple comparisons test, H = 54.93, p < 0.0001. GAL4 control versus blocked flies, p < 0.0001; UAS control versus blocked flies, p < 0.0001. ***p < 0.001, **p < 0.01, *p < 0.05.
