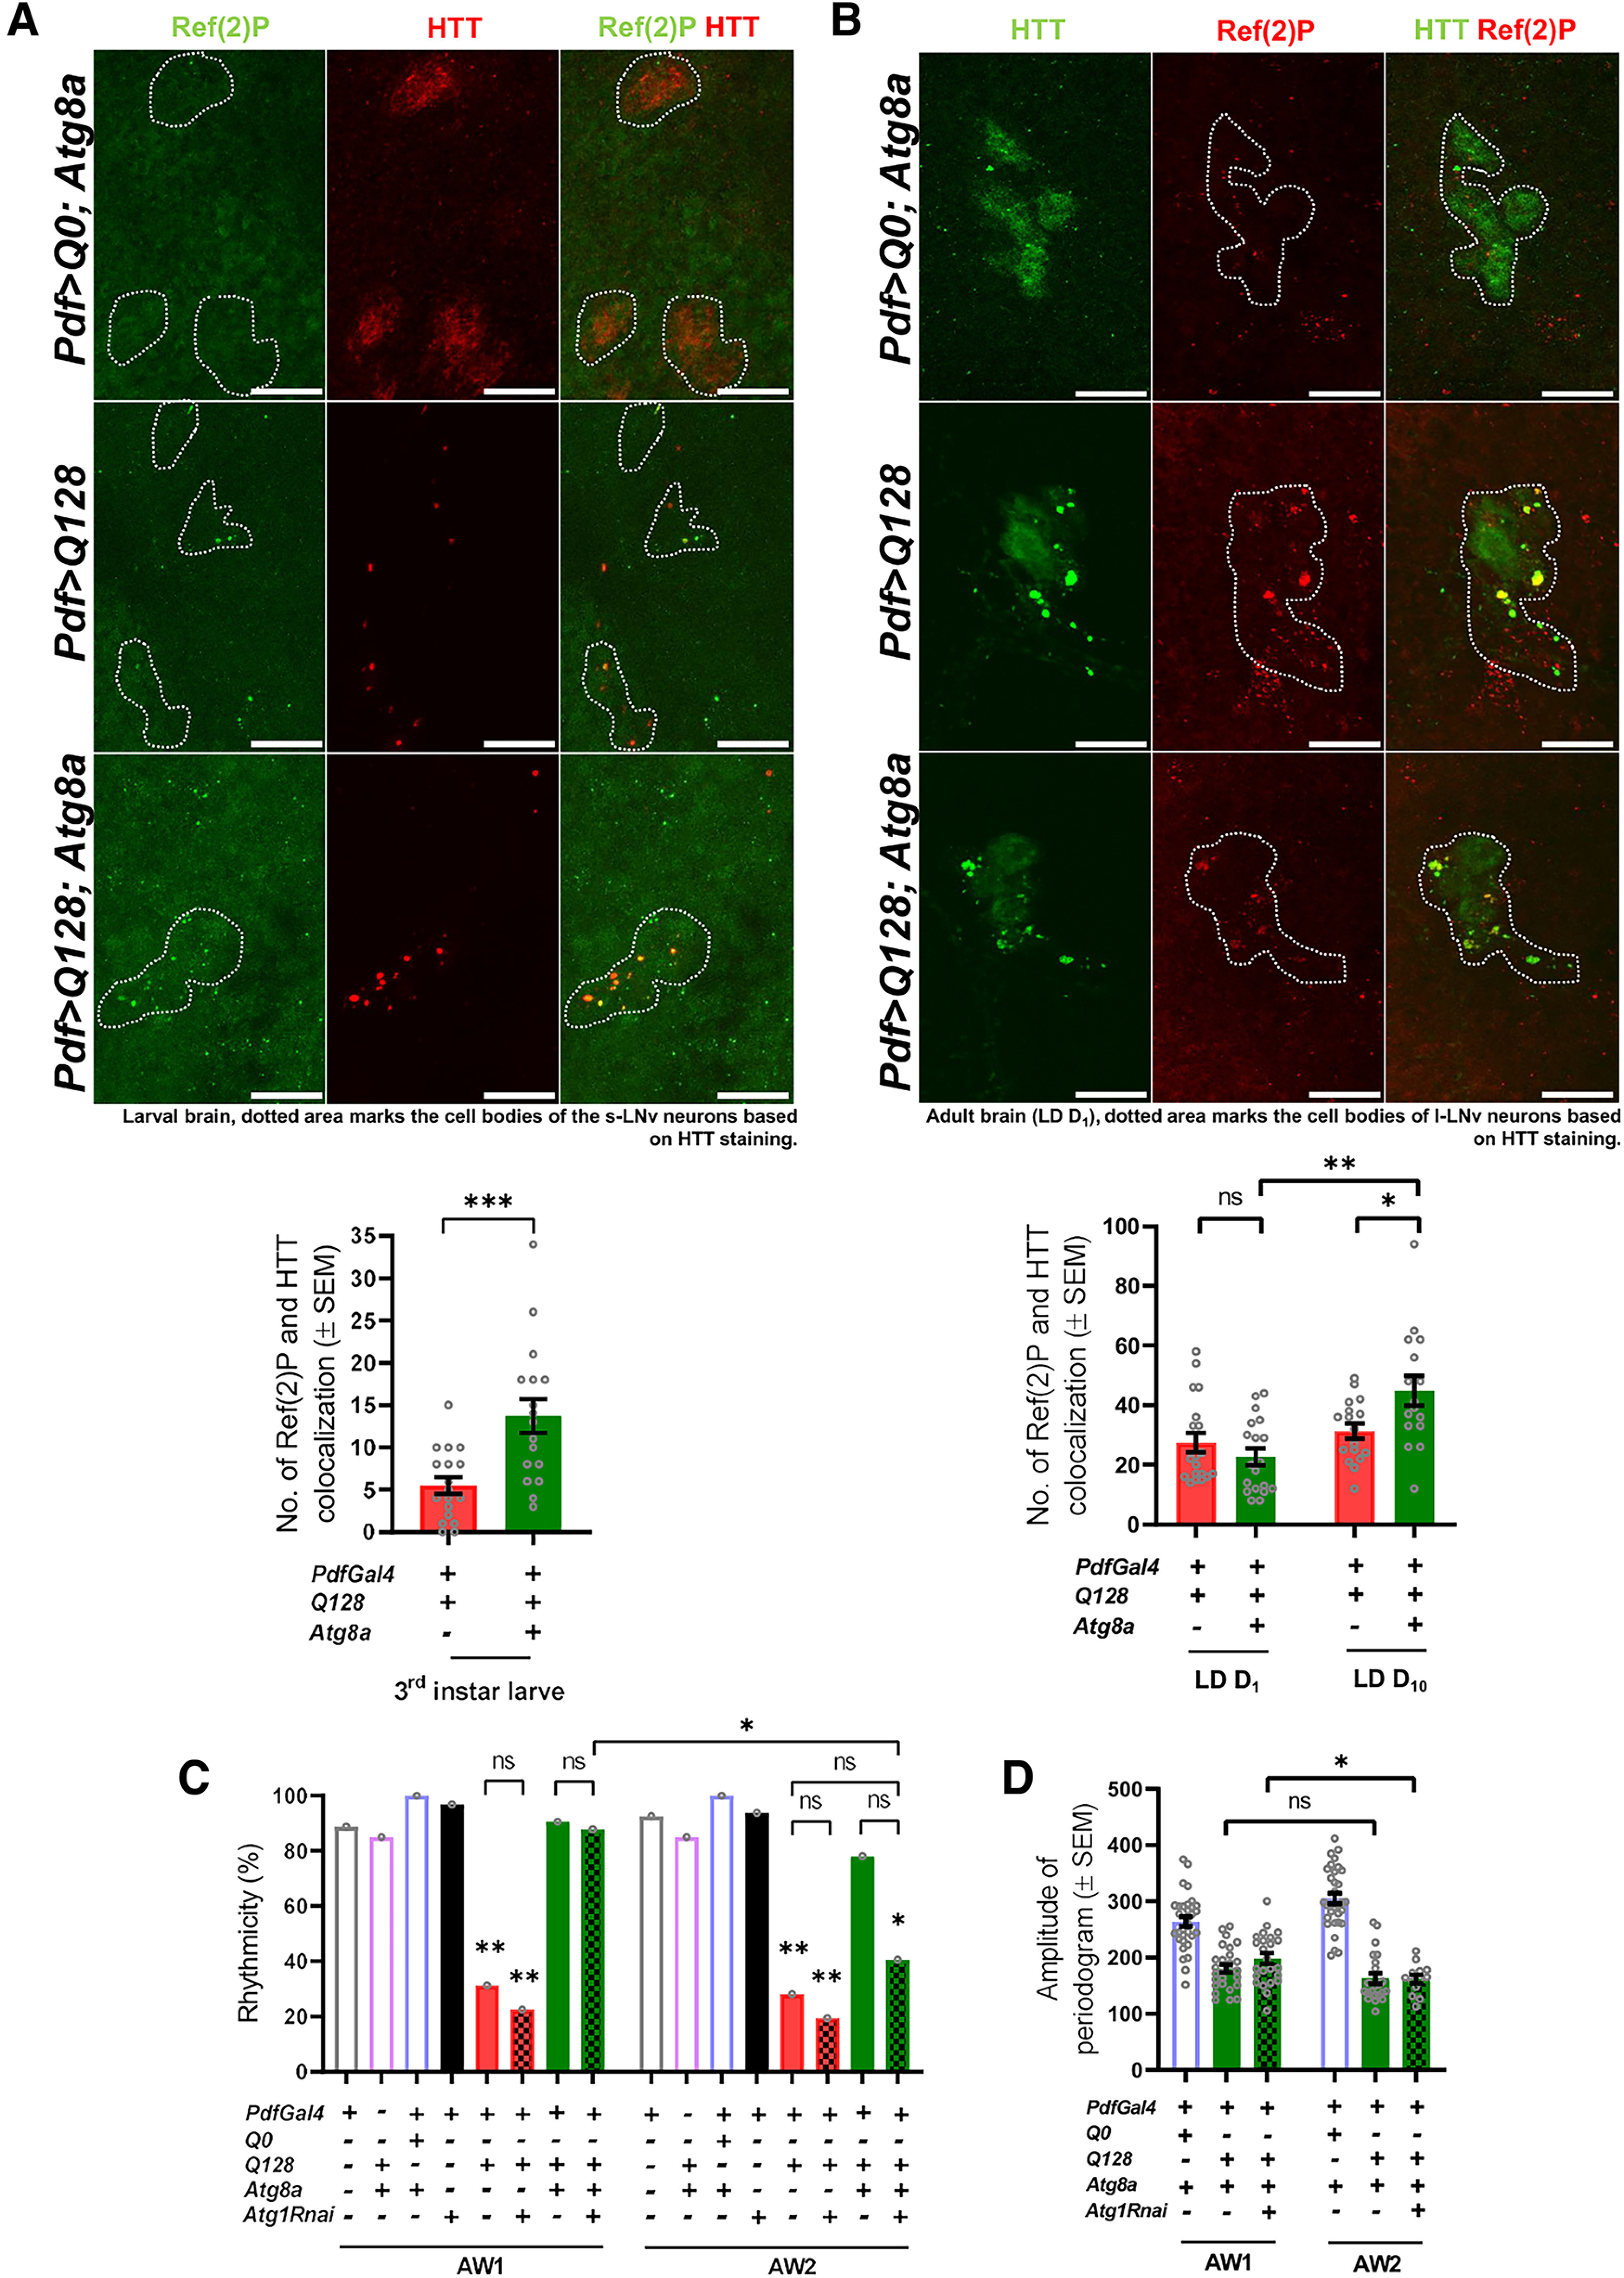
Figure 5.

Increased Ref(2)P levels in the rescue genotype suggest that Atg8a-mediated rescue in activity rhythm is autophagy-dependent. A, (+) and (–) in the bar graphs represent the presence or absence, respectively, of the gene in the fly. Representative MIP images of small PDF neurons (from L3 stage, larval brain) depicting staining for Ref(2)P protein (green), control (HTT-Q0), and mutant HTT-Q128 (red). Dotted area represents the cell bodies of the small neurons. Scale bar, 20 µm. Images for HTT-Q0 were acquired separately and not subjected to quantification. Plot represents quantification of the Ref(2)P-HTT colocalization events in small neurons for both the experimental genotypes. A mean Ref(2)P-HTT colocalization event of ∼5 was observed in flies expressing mutant HTT-Q128 protein (red bar). Compared with the flies only expressing mutant HTT-Q128 protein, a significant increase in Ref(2)P-HTT colocalization event (∼15) was observed on Atg8a overexpression. n > 16 brain hemispheres (for both genotypes). *p < 0.05. B, Representative MIP images (LD day 1, adult brain) of PDF neurons depicting staining for Ref(2)P protein (red), control (HTT-Q0), and mutant HTT-Q128 (green). Dotted area represents the cell bodies of the small neurons. Scale bar, 20 µm. Plot represents quantification of the number of Ref(2)P-HTT colocalization events quantified across two different ages (days 1 and 10) for both the experimental genotypes from large neurons. A mean Ref(2)P-HTT colocalization of ∼30 was observed in flies expressing mutant HTT-Q128 protein. Additionally, no significant change was observed in the values with age for the mutant genotype (red bar). Compared with the flies only expressing mutant HTT-Q128 protein, Atg8a coexpression does not lead to a significant increase in the number of Ref(2)P-HTT colocalization events on day 1. However, a significant increase in the colocalization was observed on day 10 compared with the values obtained from the same genotype at an earlier age (day 1) and flies only expressing mutant HTT-Q128 protein on day 10. n > 16 brain hemispheres (for both genotypes). *p < 0.05. C, Plot represents quantification of rhythmicity values quantified across 2 AWs (8 d each) for all the genotypes. Consistent with the previous results, expression of mutant HTT-Q128 protein in PDF neurons results in a significant decrease in percentage rhythmicity compared with the control genotypes (red bar). Further, coexpression of Atg8a with mutant HTT-Q128 improves the number of rhythmic individuals in both the AWs (green bar). In the first AW, downregulation of Atg1 in the rescue genotype (Pdf>Q128; Atg8a) does not lead to any significant decrease in the rhythmicity, and the values were comparable to both control and rescue genotypes. However, compared with the first AW, a significant decrease in the number of rhythmic individuals was observed in the second AW (green-filled bars). n > 16 flies/genotype. *p < 0.05. D, Plot represents rhythm amplitude values for Pdf>Q0; Atg8a, Pdf>Q128; Atg8a, and Pdf>Q128; Atg8a, Atg1Rnai flies. A significant decrease in rhythm amplitude was only observed on Atg1 downregulation in the Pdf>Q128; Atg8a background. n > 16 flies/genotypes. *p < 0.05. Asterisk on individual genotypes indicates that the genotype is significantly different from all other plotted genotypes.
