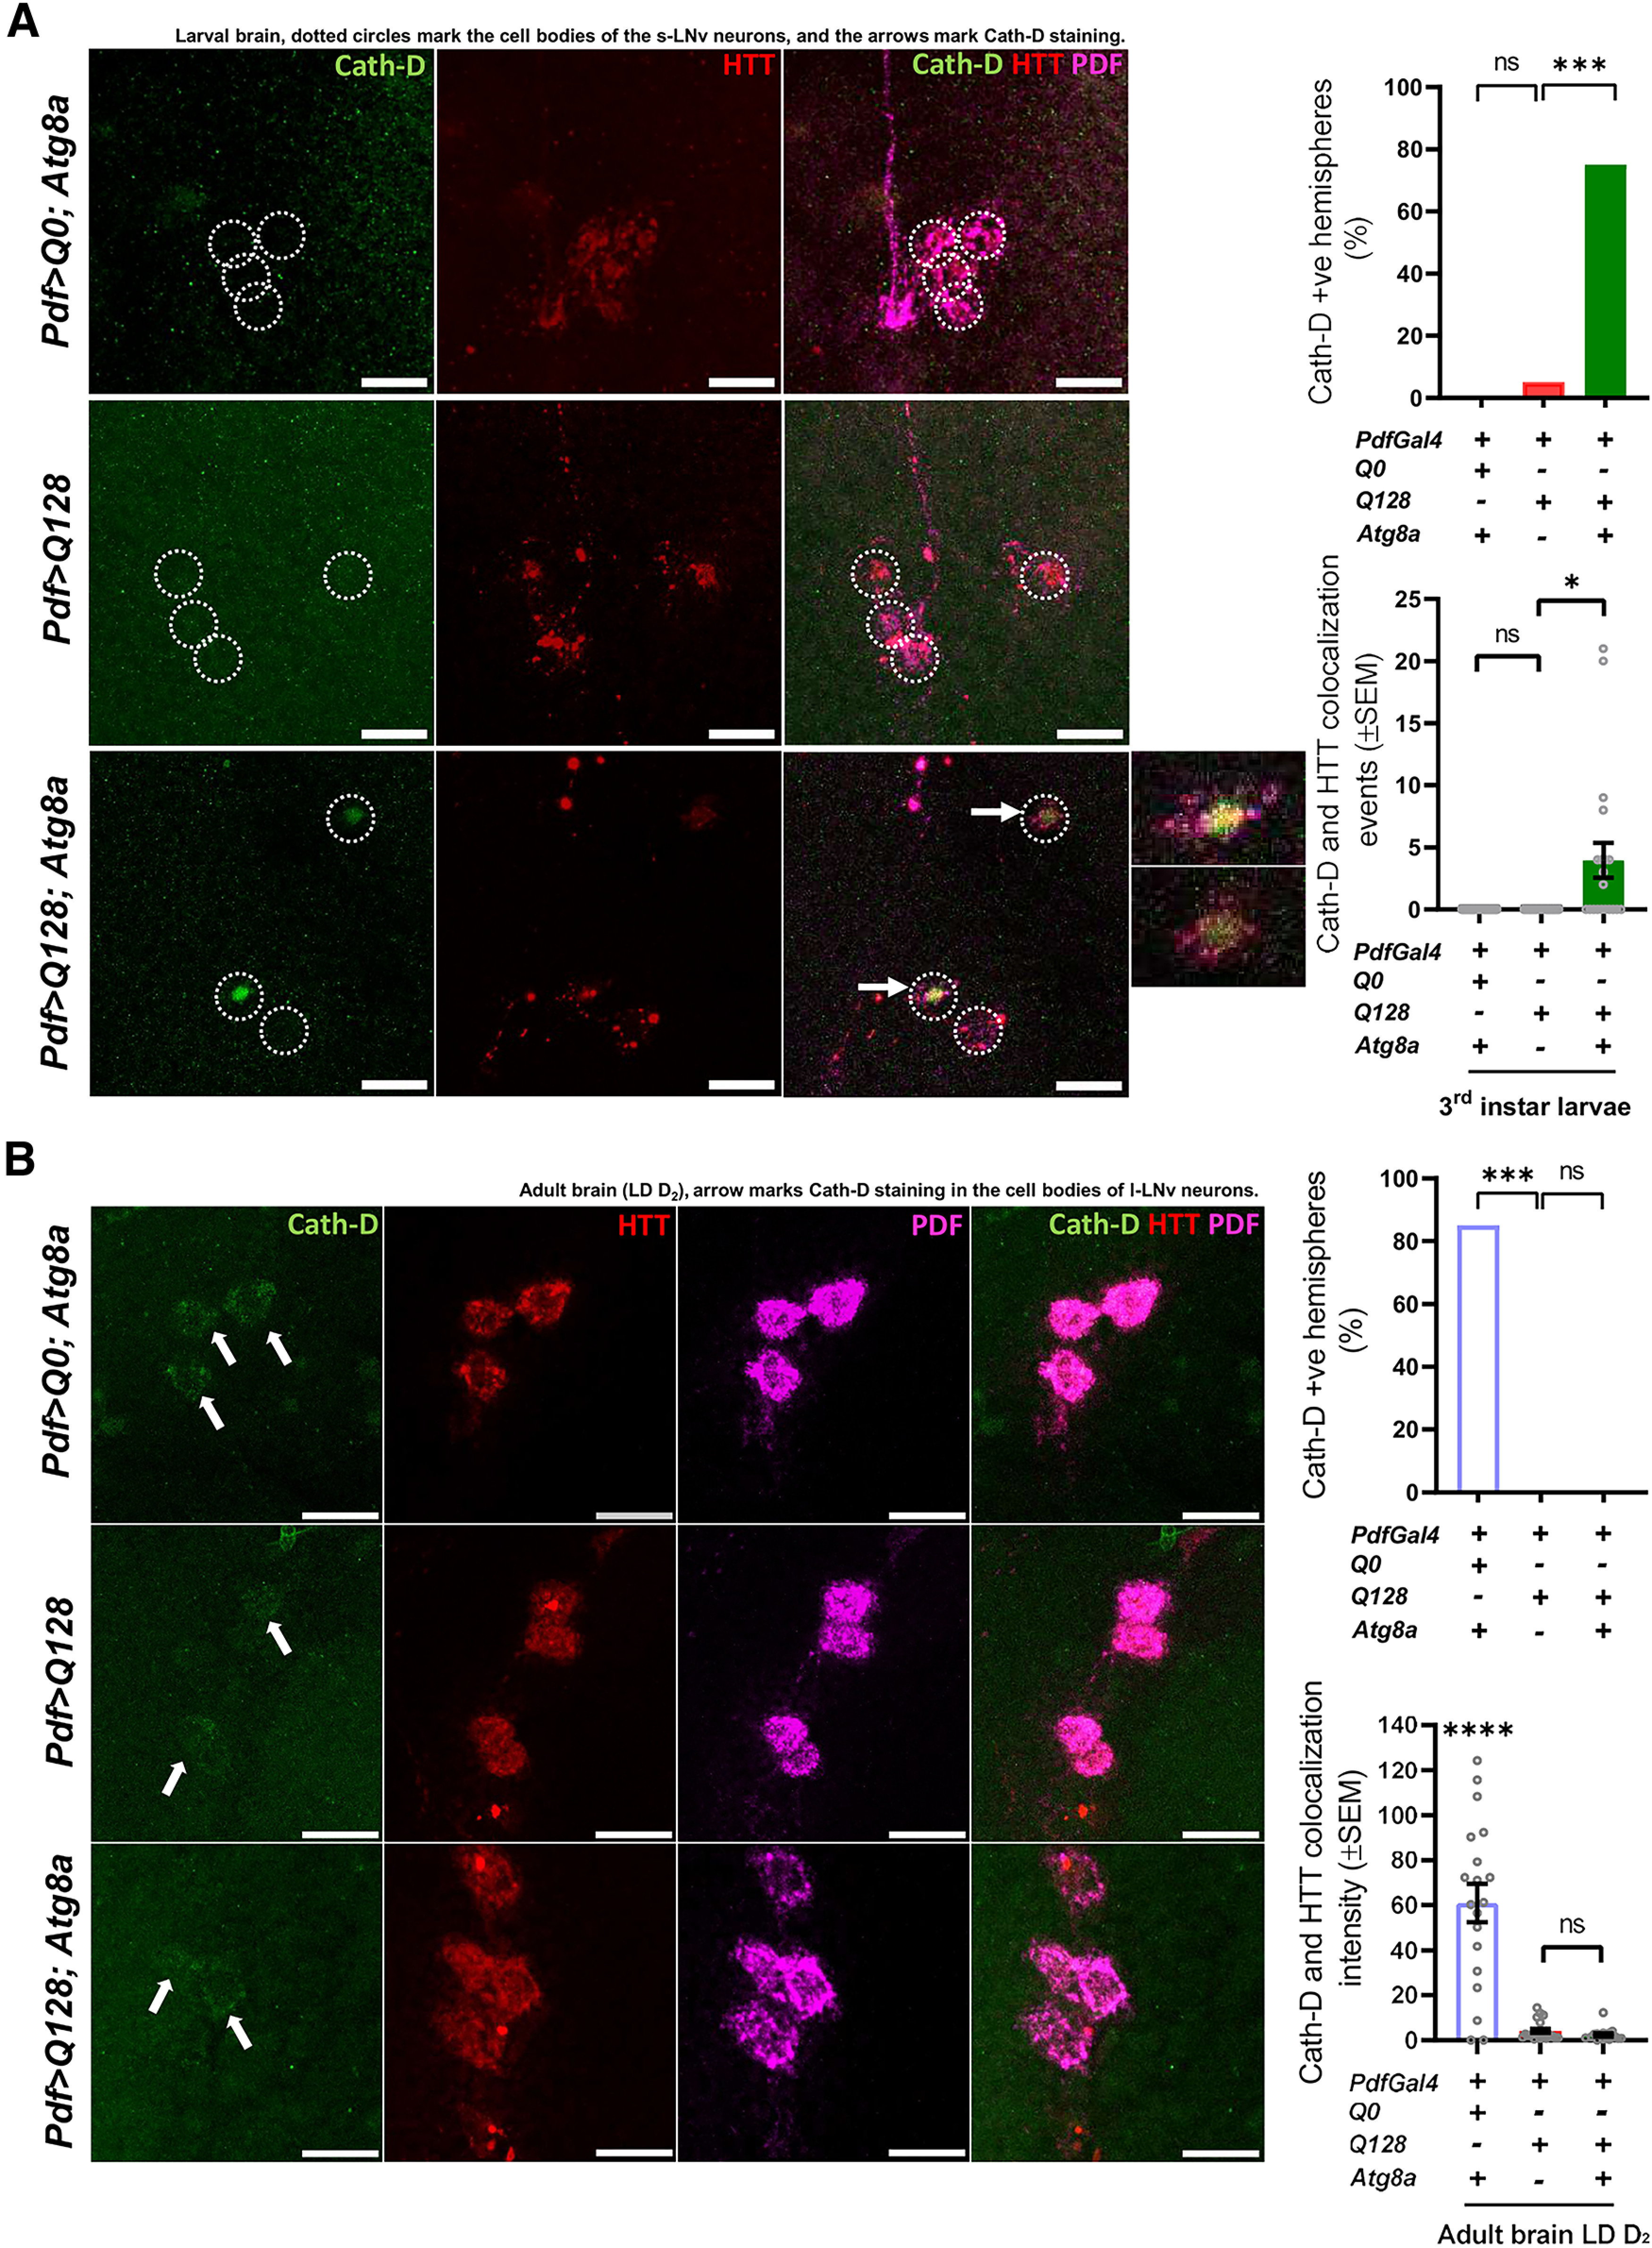
Figure 6.

Flies overexpressing Atg8a shows Cathepsin-D staining (possibly lysosome functioning) in the small neurons. (+) and (–) in the bar graphs represent the presence or absence, respectively, of the gene in the fly. A, Representative MIP images (at L3 stage, larval brain) of small PDF+ neurons, depicting staining of Cath-D (green), control (HTT-Q0) and HTT-Q128 (red), and PDF neuropeptide (magenta). Scale bar, 20 µm. Top right, Quantification showing that, in both the control genotype and flies expressing only mutant HTT-Q128 protein, no staining for Cath-D was observed in the cell bodies. However, big spot-like staining for Cath-D was observed in flies overexpressing Atg8a in the presence of mHTT. n > 14 brain hemispheres/genotype. *p < 0.05. Bottom, Quantification of Cath-D-HTT-Q128 colocalization events in control and experimental genotypes. Compared with other control and experimental genotypes, Atg8a-overexpressing flies show a significantly high number of Cath-D-HTT colocalization events. n > 14 brain hemispheres/genotype. *p < 0.05. B, Representative MIP images (LD day 1, adult brain) of large PDF+ neurons, depicting staining of Cath-D (green), control (HTT-Q0) and HTT-Q128 (red), and PDF neuropeptide (far-red). Arrow indicates the Cath-D staining in the large neurons for all genotypes. Scale bar, 20 µm. Top right, Quantification showing that staining for Cath-D (both diffuse and punctate) can be observed in the large neurons for the control genotype. No such staining pattern was observed in flies expressing either mutant HTT-Q128 protein or coexpressing Atg8a with the mutant protein. n > 16 brain hemispheres/genotype. *p < 0.05. Bottom, Quantification of Cath-D-HTT-Q128 colocalization intensity in control and experimental genotypes. Control flies show a significantly high level of Cath-D-HTT colocalization intensity compared with other experimental genotypes. n > 16 brain hemispheres/genotype. *p < 0.05. Asterisk on individual genotypes indicates that the genotype is significantly different from all other plotted genotypes.
