Figure 7.

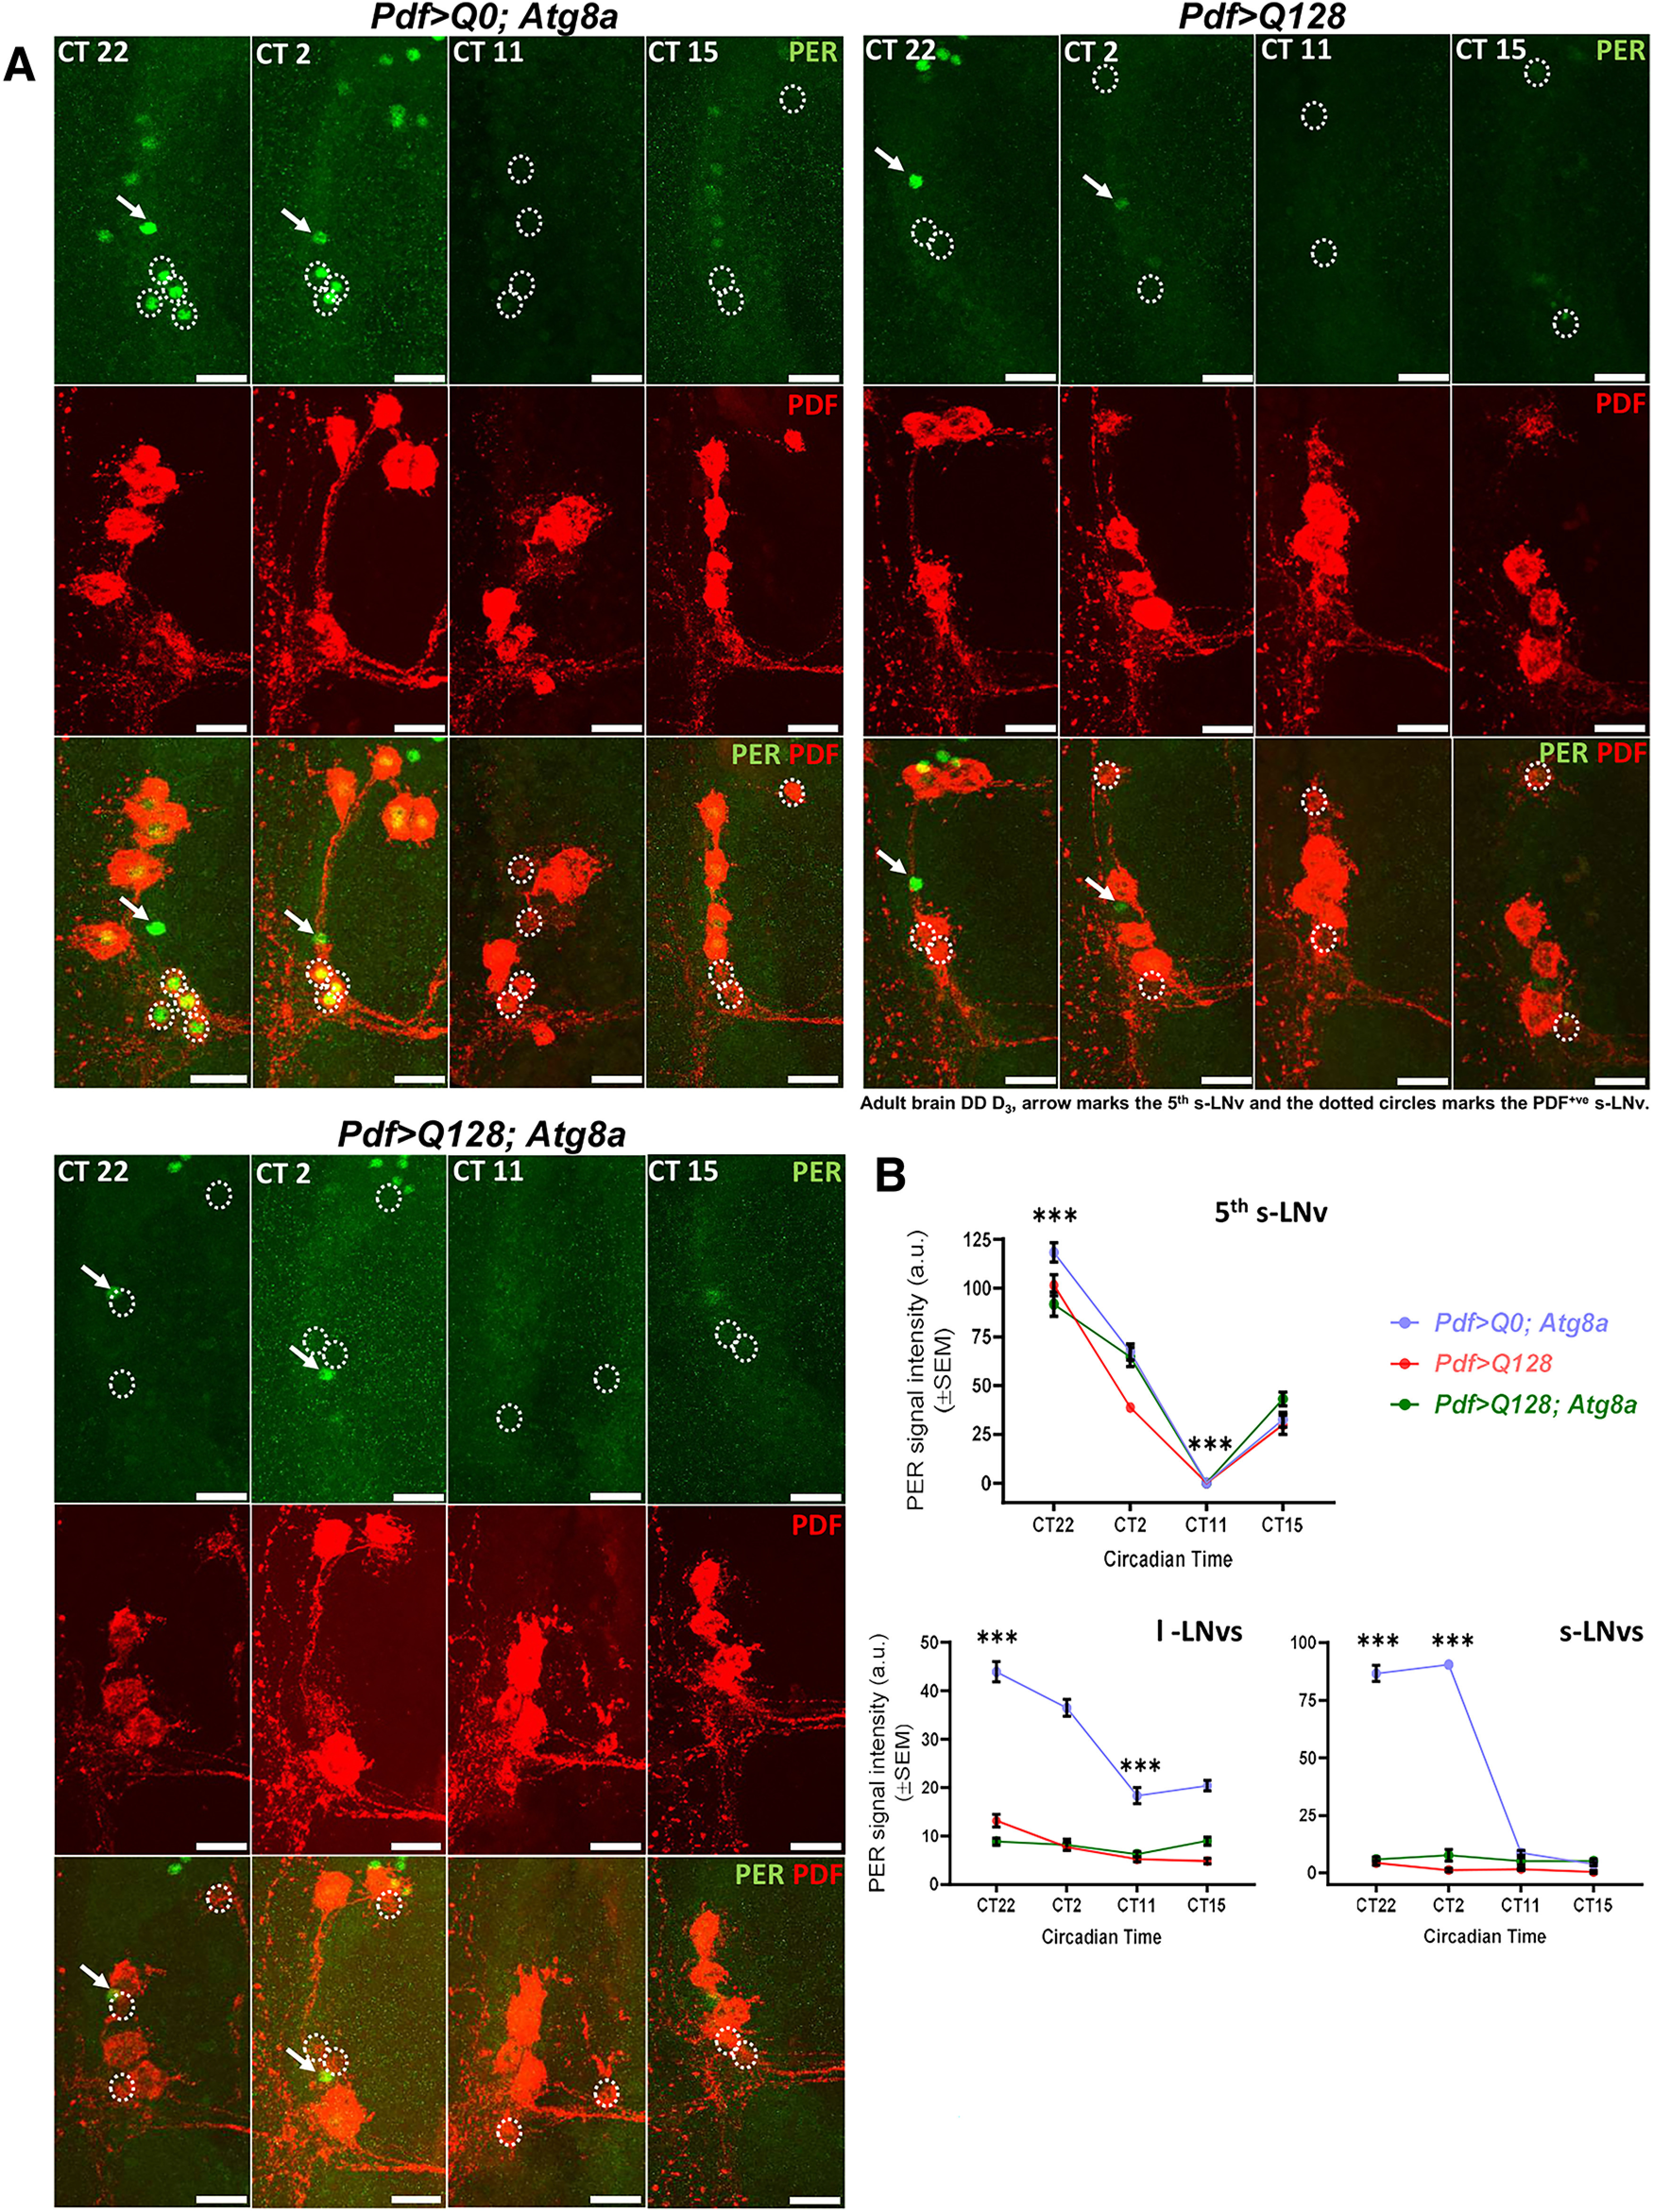
Atg8a overexpression does not improve PERIOD (PER) protein oscillations in the PDF+ lateral ventral neurons. A, Representative MIP images (DD day 3, adult brain) of PDF neurons and fifth small lateral ventral neuron (do not express PDF neuropeptide and served as our control for the PER staining) depicting staining for PER protein (green) and PDF neuropeptide (red) for four circadian time points (CT22, CT2, CT11, and CT15). Arrow indicates fifth s-LNv. Dotted circles represent small PDF neurons. Scale bar, 20 µm. B, Plots represent quantification of the mean signal intensity of PER protein, quantified on DD day 3 from fifth small lateral ventral neuron (left), PDF+ small neurons (middle), and large neurons (right) at four different circadian time points. Fifth small ventral neuron shows time-dependent oscillation of PER protein in all the genotypes. Compared with the control genotype, expression of mutant HTT-Q128 protein in both small and large neurons significantly hampers the PER protein levels and oscillation in both small and large neurons (red curve). No significant improvement was observed in PER protein levels or oscillation on Atg8a overexpression in the presence of mutant HTT-Q128 protein in the PDF neurons (green curve). n > 16 brain hemispheres/time point (for control genotype), and n > brain 18 hemispheres/time point (for experimental genotypes). *p < 0.05. Asterisk on individual genotypes indicates that the genotype is significantly different from all other plotted genotypes and time points.
