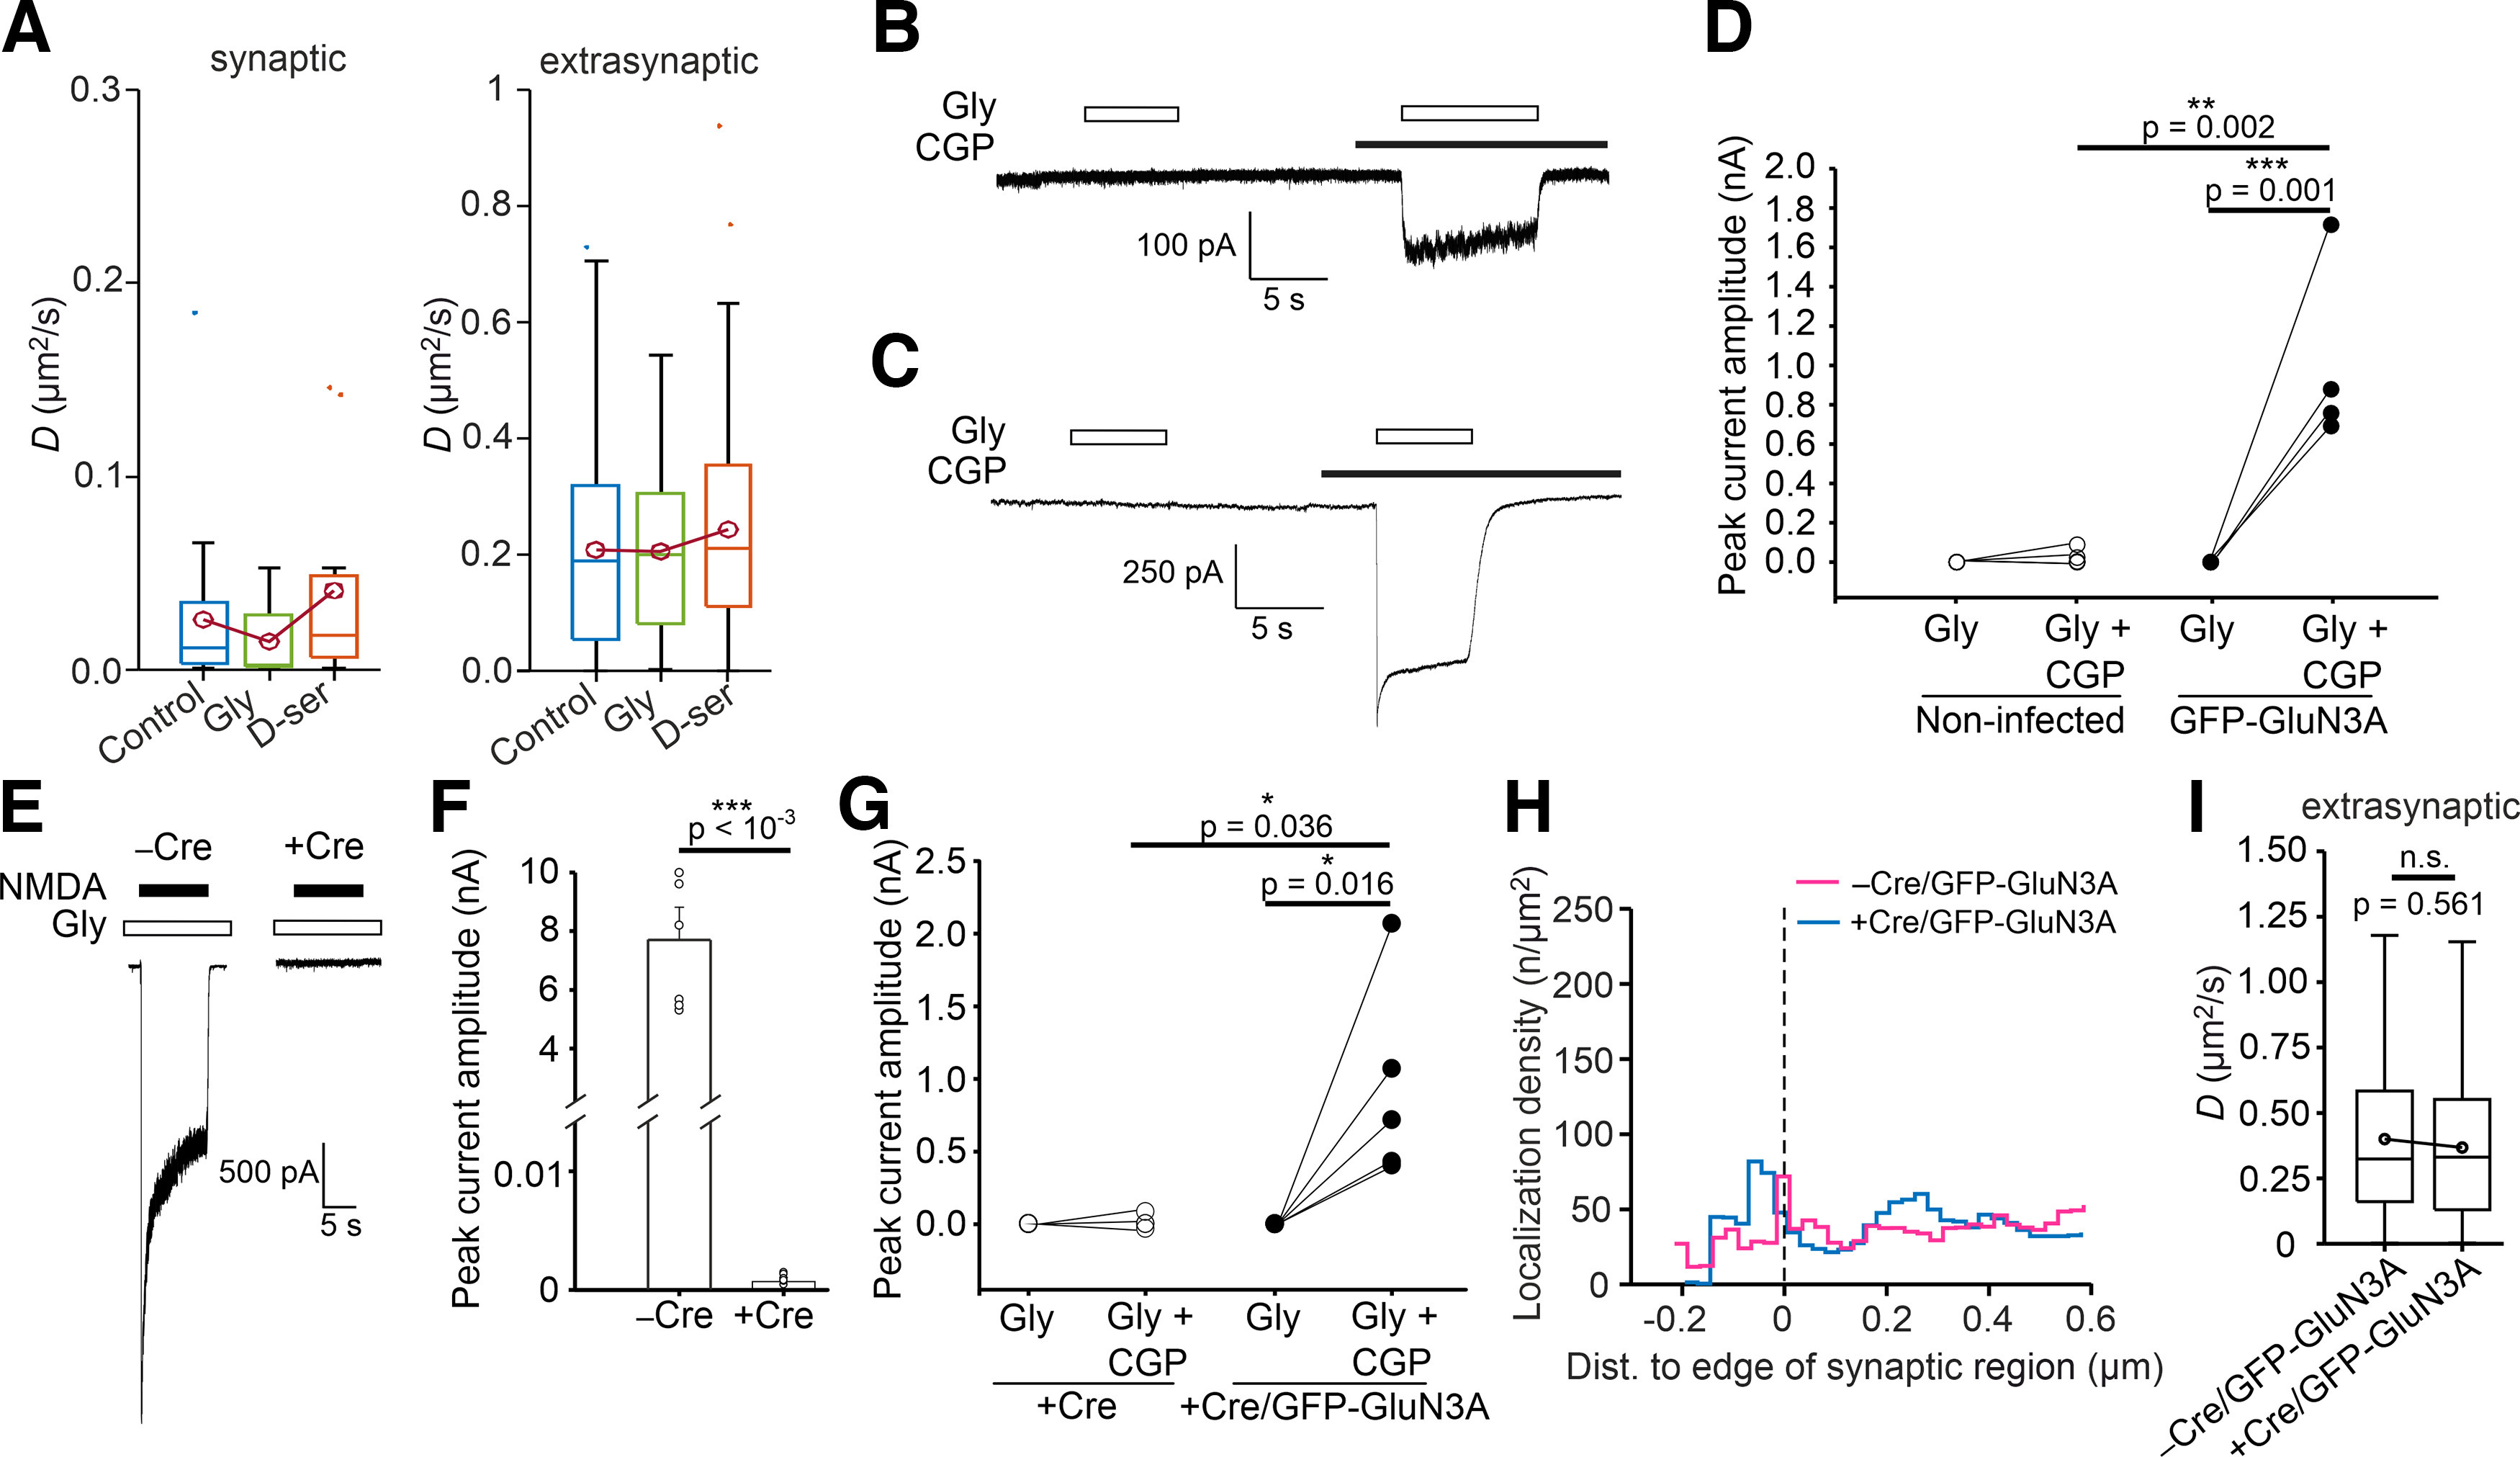
Figure 5.

The presence of extracellular glycine, d-serine, or endogenous GluN2A and GluN2B subunits does not affect the synaptic or extrasynaptic QD trajectories of NMDARs containing GFP-GluN3A subunit. A, Box plots summarizing the D values calculated from the QD trajectories in neurons expressing GFP-GluN3A subunit measured in the synaptic and extrasynaptic regions (defined using Method 1). Where indicated, glycine (Gly; 30 μm) or d-serine (D-ser; 30 μm) were added to the imaging solution; median D values [synaptic, extrasynaptic] (µm2/s): Ctrl [0.0011, 0.1889]; glycine [0.0179, 0.2112]; d-serine [0.0027, 0.1996]; K–W test: p = 0.283, F(2,33) = 2.52 (for synaptic QD trajectories); p = 0.364, F(2,237) = 2.023 (for extrasynaptic QD trajectories). B, C, Representative whole-cell voltage-clamp recordings of noninfected rat hippocampal neurons (B) and those infected with the GFP-GluN3A subunit (C); both were obtained at a membrane potential of −60 mV. Currents were elicited by application of 100 μm glycine (Gly; empty bar); where indicated, 0.5 μm CGP-78608 (CGP; black bar) was applied immediately before and during Gly application (Gly+CGP). D, Summary of peak current amplitudes evoked by 100 μm glycine (Gly) or 100 μm glycine and 0.5 μm CGP-78608 (Gly+CGP) application in rat hippocampal neurons noninfected or infected with GFP-GluN3A subunit; Student's t test: t(7) = 5.172 Gly versus Gly+CGP (GFP-GluN3A); t(7) = 5.034 noninfected versus GFP-GluN3A (Gly+CGP), p-values are denoted in the figure (n ≥ 5 cells/group). E, Representative whole-cell patch-clamp recordings of current responses evoked by rapid application of 1 mm NMDA (black bar), in the continuous presence of 20 μm glycine (Gly), in hippocampal neurons from cKO-GluN2A/GluN2B mice (DIV14), which were infected at DIV7 using lentiviruses encoding tdTomato-Homer1c (–Cre) or Cre-tdTomato-Homer1c (+Cre); measured at a membrane potential of −60 mV. F, Summary of peak current amplitudes evoked by NMDA application in hippocampal neurons from cKO-GluN2A/GluN2B mice (–Cre or +Cre; shown in E); Student's t test: t(10) = 5.158; (n ≥ 5 cells/group). G, Summary of peak current amplitudes evoked by 100 μm glycine (Gly) or 100 μm glycine and 0.5 μm CGP-78608 (Gly+CGP) application in hippocampal neurons from cKO-GluN2A/GluN2B mice infected with Cre-tdTomato-Homer1c (+Cre) or coinfected with Cre-tdTomato-Homer1c and GFP-GluN3A subunit (+Cre/GFP-GluN3A); measured at a membrane potential of −60 mV; Student's t test: t(7) = 6.124 Gly versus Gly+CGP (+Cre/GFP-GluN3A); t(7) = 2.595 +Cre versus +Cre/GFP-GluN3A (Gly+CGP), p-values are denoted in the figure (n ≥ 5 cells/group). H, Histogram of the localization density of nanoGFP- QD605 localizations plotted against the distance to the edge of the synaptic region (indicated by the vertical dashed line at 0); n > 9813 localizations for the labeled GFP-GluN3A subunit per condition, measured in hippocampal neurons from cKO-GluN2A/GluN2B mice coinfected with GFP-GluN3A subunit and tdTomato-Homer1c (–Cre/GFP-GluN3A) or Cre-tdTomato-Homer1c (+Cre/GFP-GluN3A). I, Box plots summarizing the D values calculated from the extrasynaptic QD trajectories in hippocampal neurons from cKO-GluN2A/GluN2B mice coinfected with GFP-GluN3A subunit and tdTomato-Homer1c (-Cre/GFP-GluN3A) or Cre-tdTomato-Homer1c (+Cre/GFP-GluN3A), measured in extrasynaptic regions [defined using Method 1; median D values (µm2/s): –Cre/GFP-GluN3A 0.331, +Cre/GFP-GluN3A 0.324; passed the D'Agostino-Pearson's normality test after log-transformation; Student's t test: t(311) = 0.582, with p-values denoted in plots].
