Figure 8.
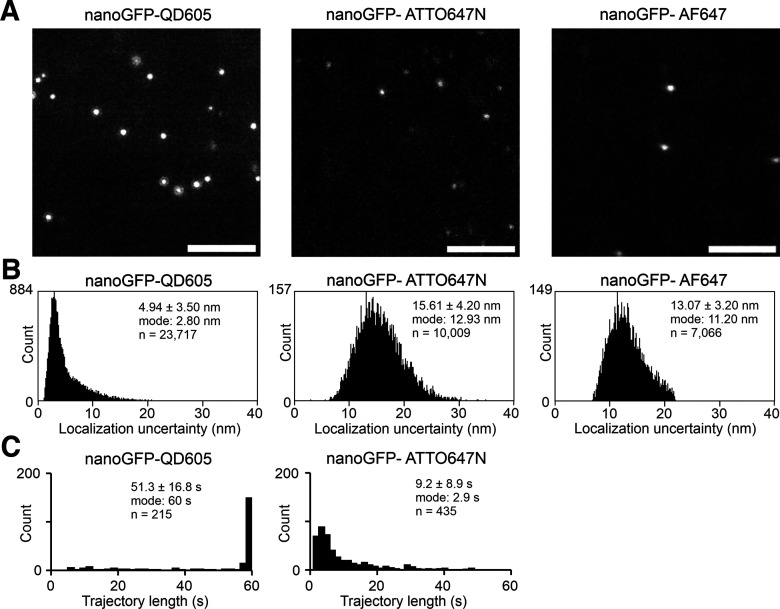
Comparison of nanoGFP-QD605, nanoGFP-ATTO647N, or nanoGFP-AF647 probes in respect of localization accuracy and/or effective lifetime for surface tracking of NMDARs. A, Representative single frames of NMDARs containing GFP-GluN2A subunit stained by nanoGFP-QD605 or nanoGFP-ATTO647N probes for surface mobility/uPAINT and by nanoGFP-AF647 probe for dSTORM imaging. Scale bar, 6 µm. B, Histogram of localization uncertainty from corresponding images of A; localizations were detected in the representative area (20 µm2) with ImageJ plugin ThunderSTORM from multiple consecutive frames to reach n > 5000 localizations for each condition; probes were detected with the same detection parameters (B-spline wavelet filter: Order 3, scale 2.0; approximate localization, local maximum; threshold, 2 × background; connectivity, 8 neighborhoods; subpixel localization, PSF-integrated Gaussian; fitting radius, 3 px; fitting method, weighted least squares; initial σ, 1.6 px; multiemitter fitting, false); insets represent the average uncertainty (mean ± SD), the most often occurring uncertainty (mode), and the number of localizations (n); note that acquisitions of all three probes were performed with different microscopes. C, Lengths of synaptic trajectories (defined by Method 1) recorded for GFP-GluN2A-containing NMDARs were used to compare the effective lifetime of nanoGFP-QD605 or nanoGFP-ATTO647N probes for surface tracking; histograms show the lengths of trajectories in seconds (s) recorded with indicated nanoGFP-QD605 or nanoGFP-ATTO647N probes; insets represent the average duration (mean ± SD), the most often occurring length (mode), and the number of trajectories (n).

