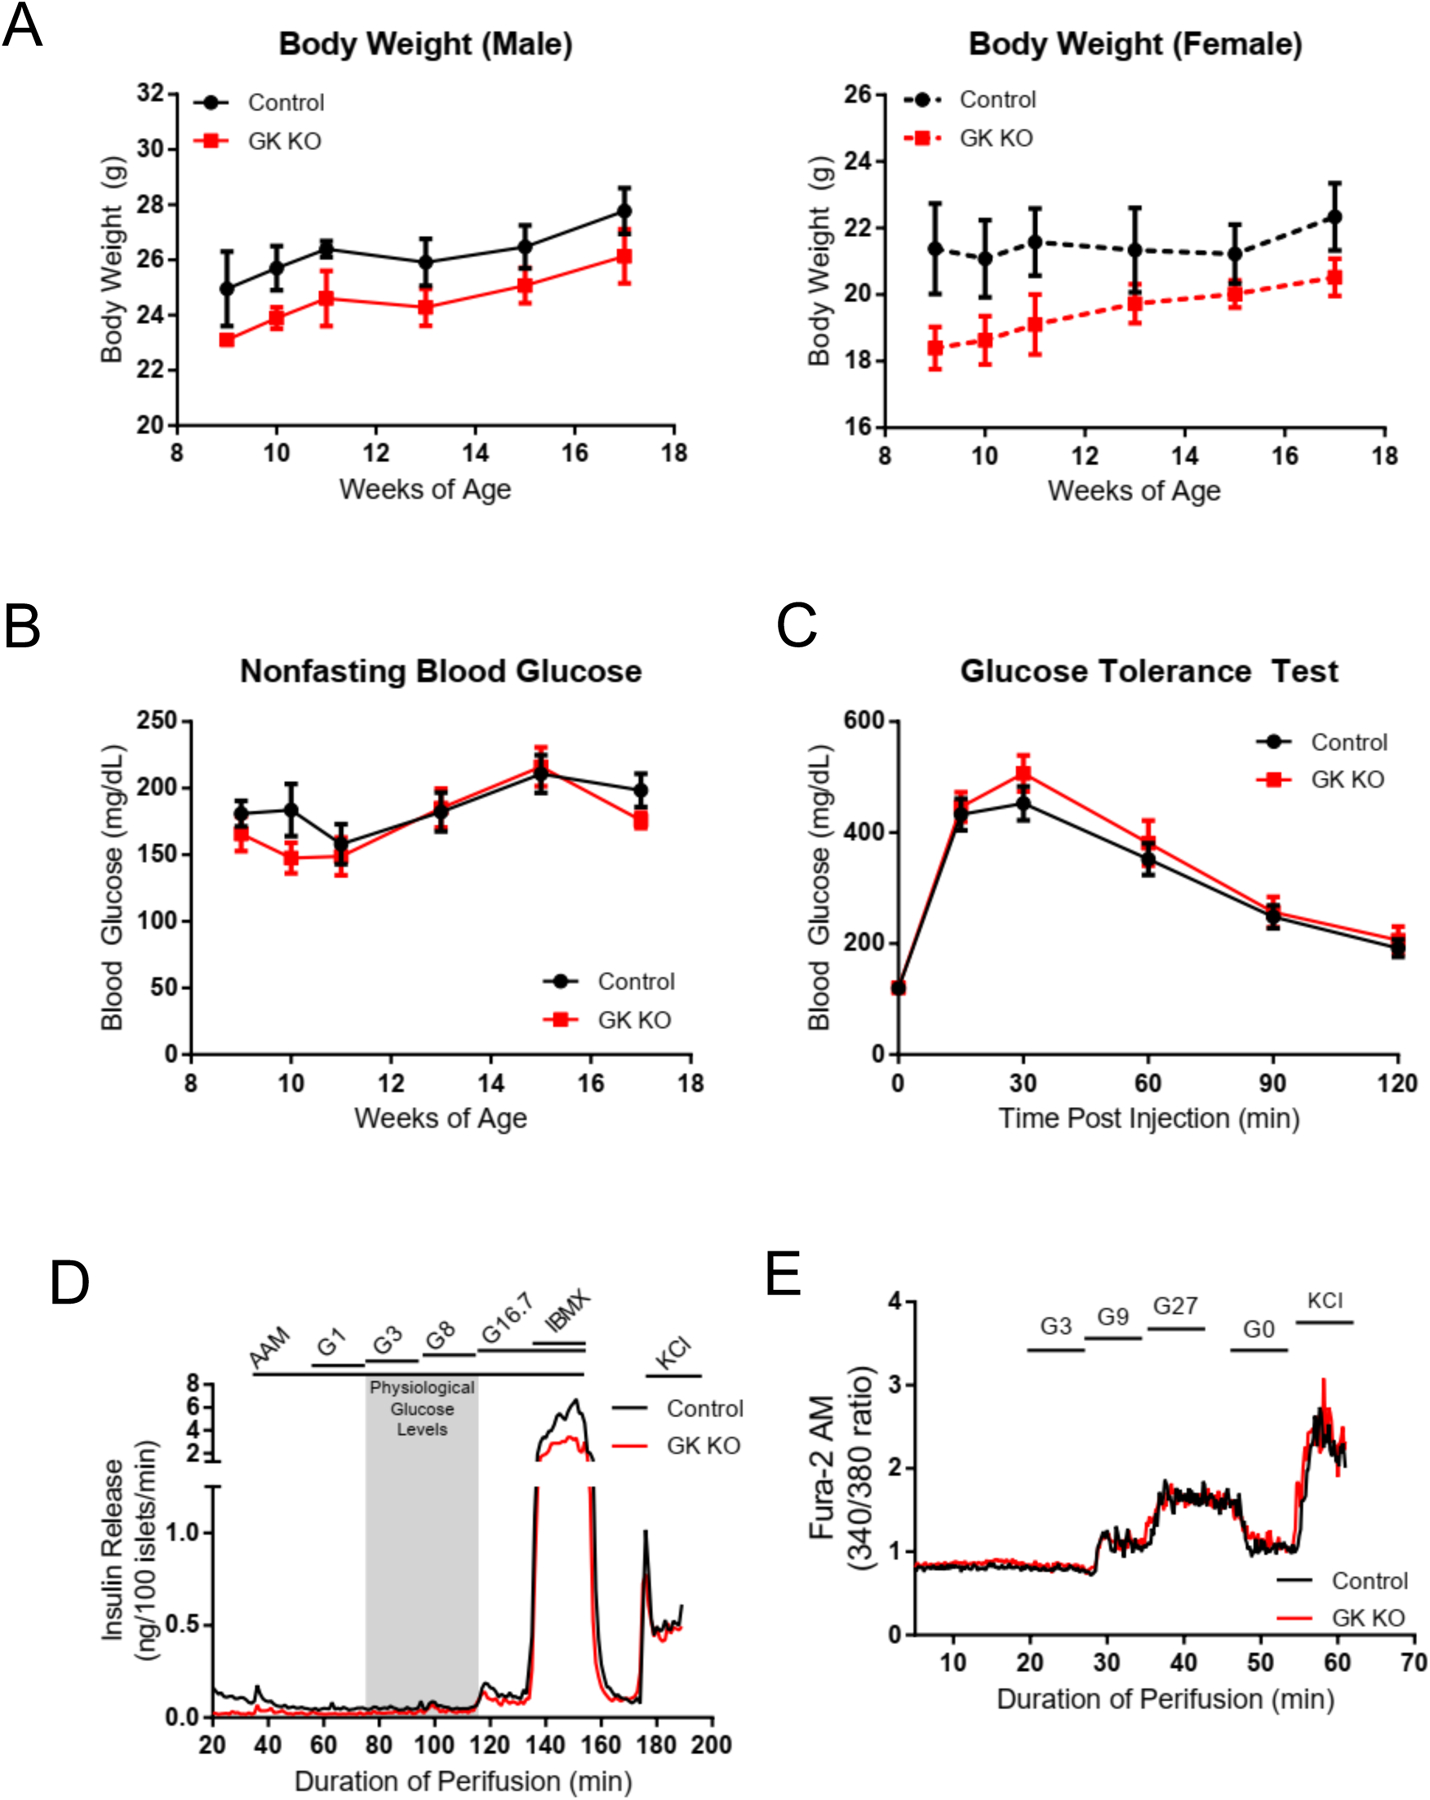
Figure 2: Metabolic Characterization of GKKO mice and GKKO islets.

(A) Body weights of male GKKO (n=5) and control (n=6), and female GKKO (n=6) and control (n=5) mice were recorded over 8 weeks, with no statistically significant differences between control and GKKO mice. (B) Nonfasting blood glucose in the same cohort of mice over the same 8-week period (GKKO, n=11. Control, n=12). (C) Glucose tolerance as assessed by IPGTT after a 16-hour fast in 18 week old GKKO mice (n=11) compared to 18 week old control mice (n=11). Note that fasting glucose levels. (t=0) are not different between the two groups. (D) Pooled islets from three age, sex, and genotype matched mice were isolated (n=3 experiments) and perifused with the regime indicated with no difference in GSIS. A physiological 4 mM amino acid mixture was used to establish baseline secretion before the addition of the indicated glucose regimen or IBMX to increase intracellular cAMP levels. (E) Islets isolated from GKKO (n=2) and control (n=2) mice were perifused with a physiological 4 mM amino acid mixture before addition of the indicated glucose regime and Fura2-AM fluorescence was measured to determine intracellular calcium levels. Data shown in A,B and C are presented as mean +/− SEM.
