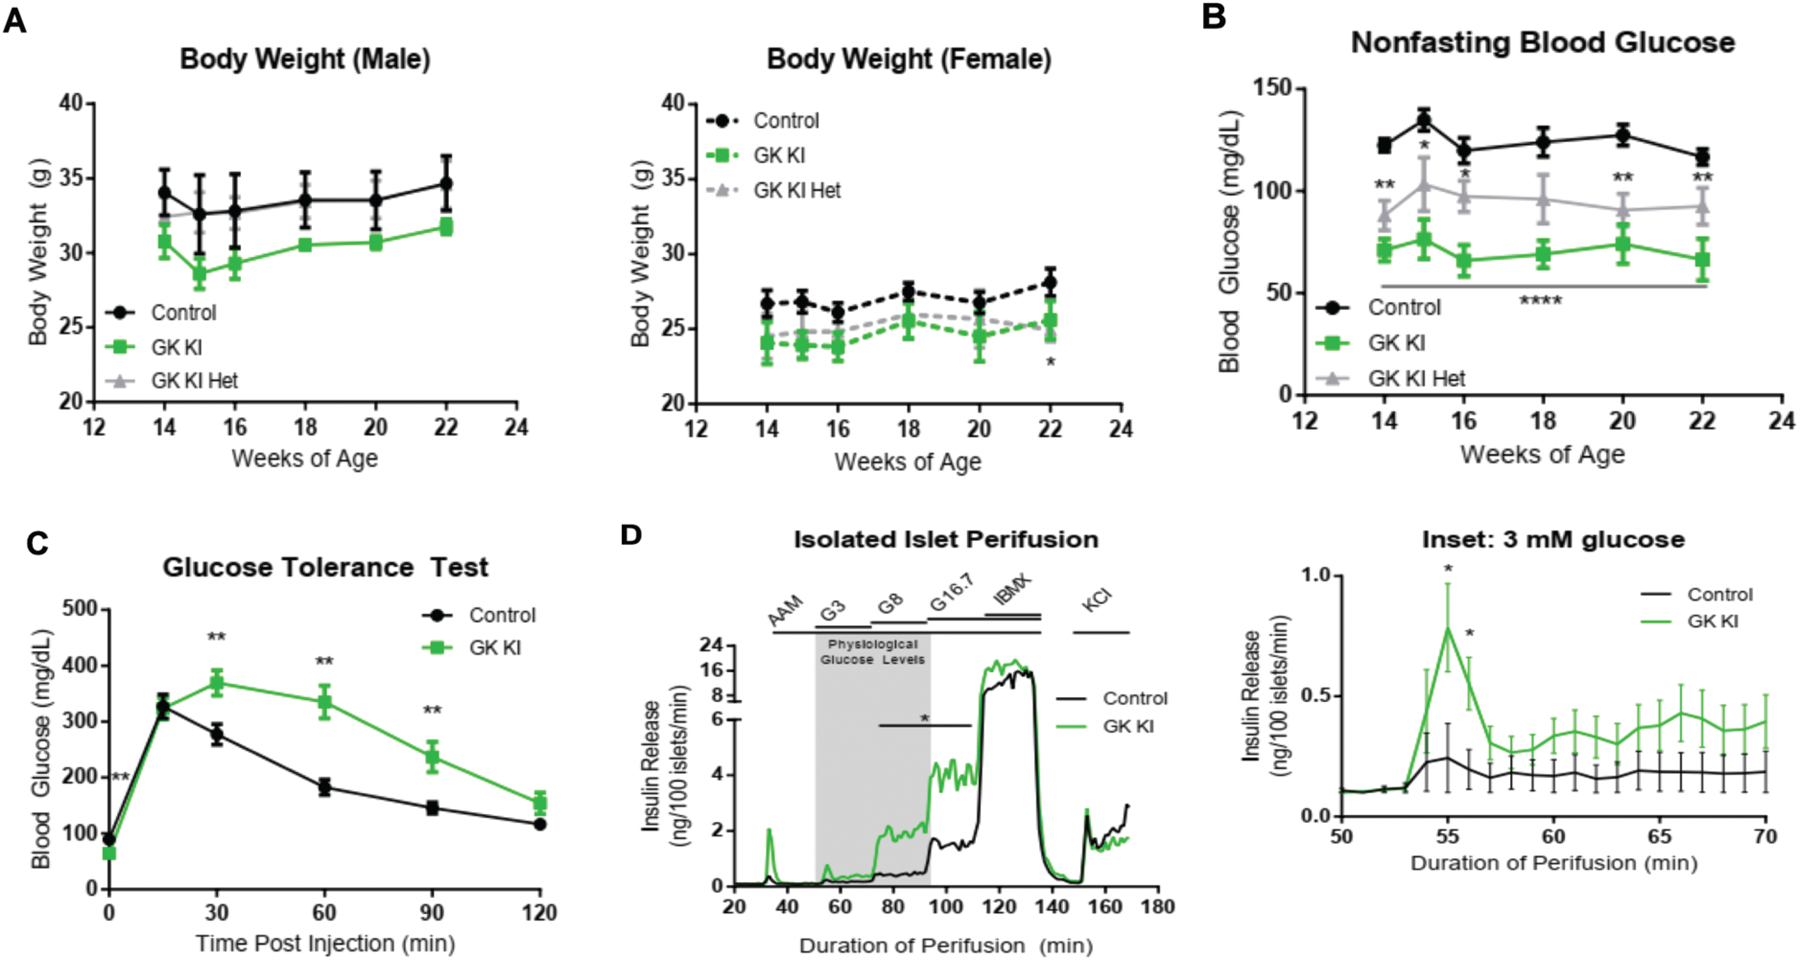
Figure 3: Metabolic Characterization of GKKI mice and GKKI islets.

(A) Body weights of male GK KI (n=6), GK KI Het (n=4), and Control (n=7) mice and female GKKI (n=4), GK KI Het (n=4), and Control (n=7) mice were recorded over 8 weeks with no statistically significant difference between KI and control mice except for one week between female control and GK KI Het mice. (B) Nonfasting blood glucose levels of the same cohort of mice were recorded over the same 8-week period (GK KI, n=10; GK KI Het, n=8; Control, n=14). The GK ins454A allele had a gene-dosage dependent effect on lowering basal blood glucose levels. (C) IPGTT tests after a 16-hour fast in control (n=16) and GKKI (n=11) mice showed lower fasting blood glucose levels (t = 0) and decreased glucose tolerance over 2 hours post injection in GK KI mice. (D) Perifusion assay of Islets isolated from GKKI (n=8) and Control (n=8) mice. A physiological 4 mM amino acid mixture was used to establish baseline secretion before the addition of the indicated glucose regimen or IBMX to increase intracellular cAMP levels. The inset shows the response of the GK KI islets to 3 mM glucose, which is driven by the activating mutation in glucokinase in a subset of beta cells. Data shown in A,B and C are presented as mean +/− SEM. *. P<
