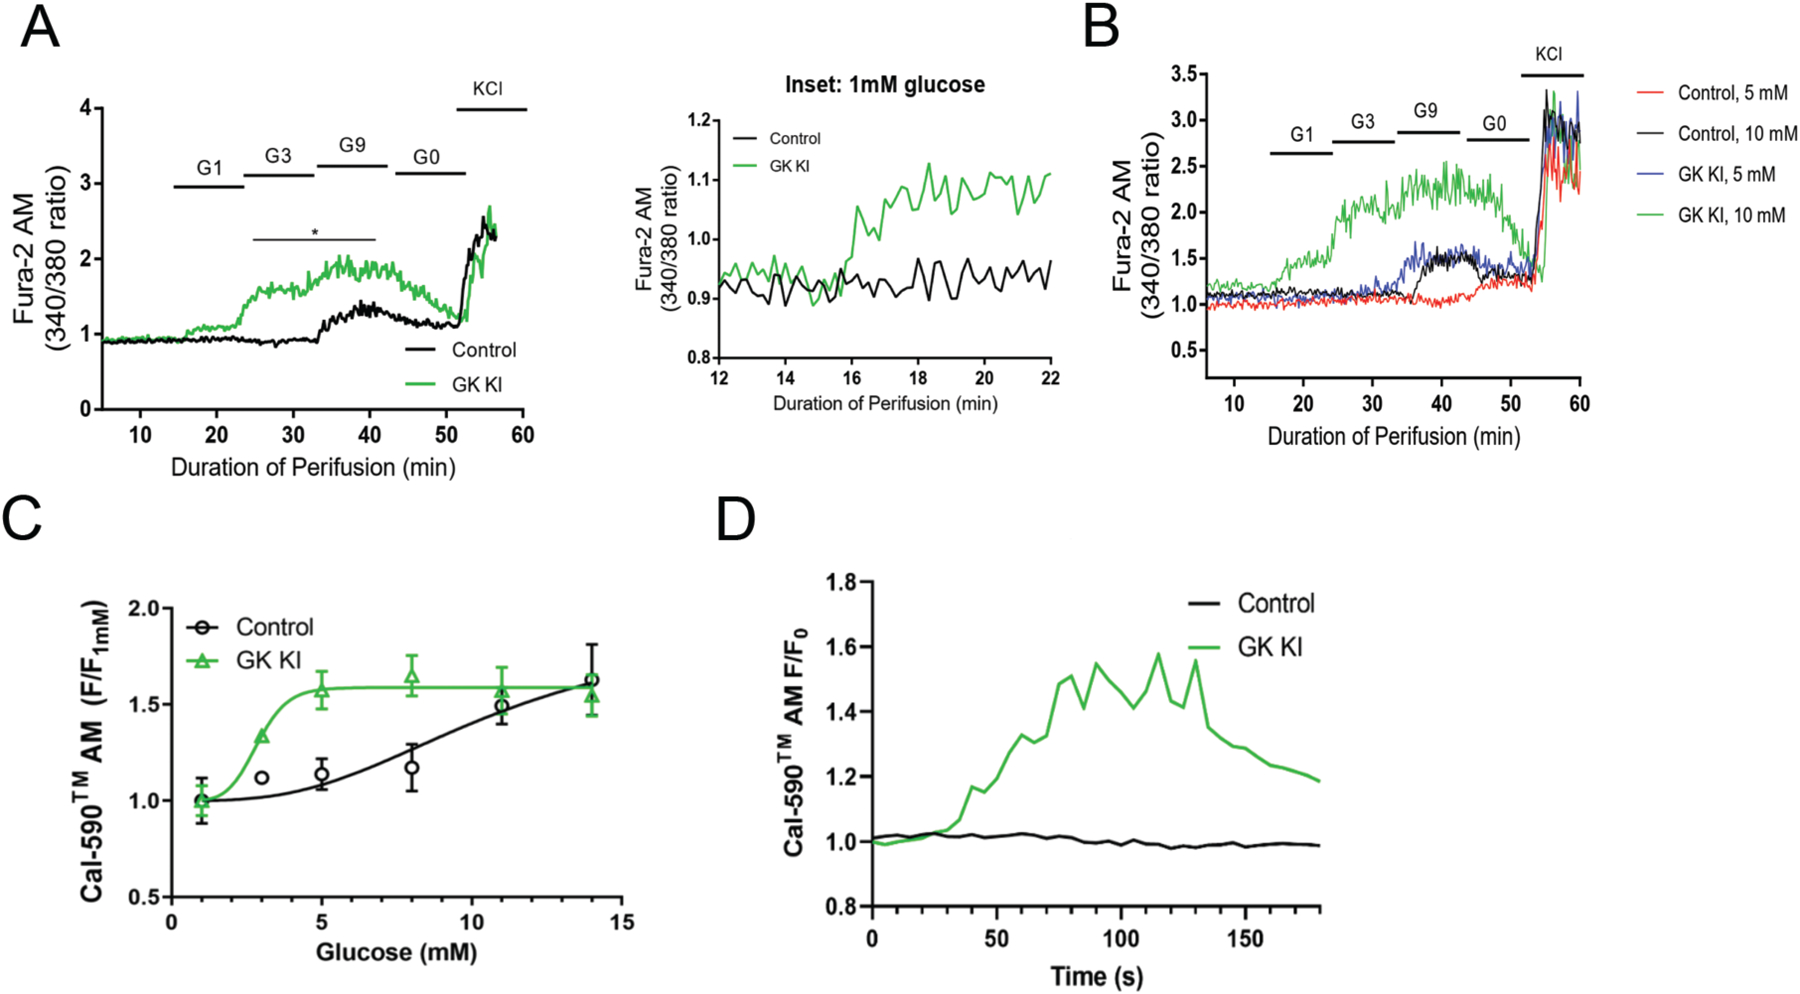
Figure 4: Analysis of intracellular calcium confirms left shift in glucose response of GKKI islets.

(A) Isolated islets from GKKI (n=4) and control (n=4) mice were perifused with the indicated glucose regime and Fura2-AM fluorescence was measured to determine calcium activity. (B) Intracellular calcium was measured in control (n=2) and GKKI (n=2) islets cultured at either 5 mM glucose or 10 mM glucose, demonstrating that glucose sensitivity is lost in control but retained in GKKI islets cultured at 5 mM glucose. (C) Intracellular calcium was measured in islets from GKKI and control mice at six glucose concentrations; the GKKI islets showed a dose-response profile shifted towards lower glucose concentrations. (D) Representative calcium traces for GKKI and Control islets at 1 mM glucose. Data shown are presented as mean +/− SEM. *, p < .05.
