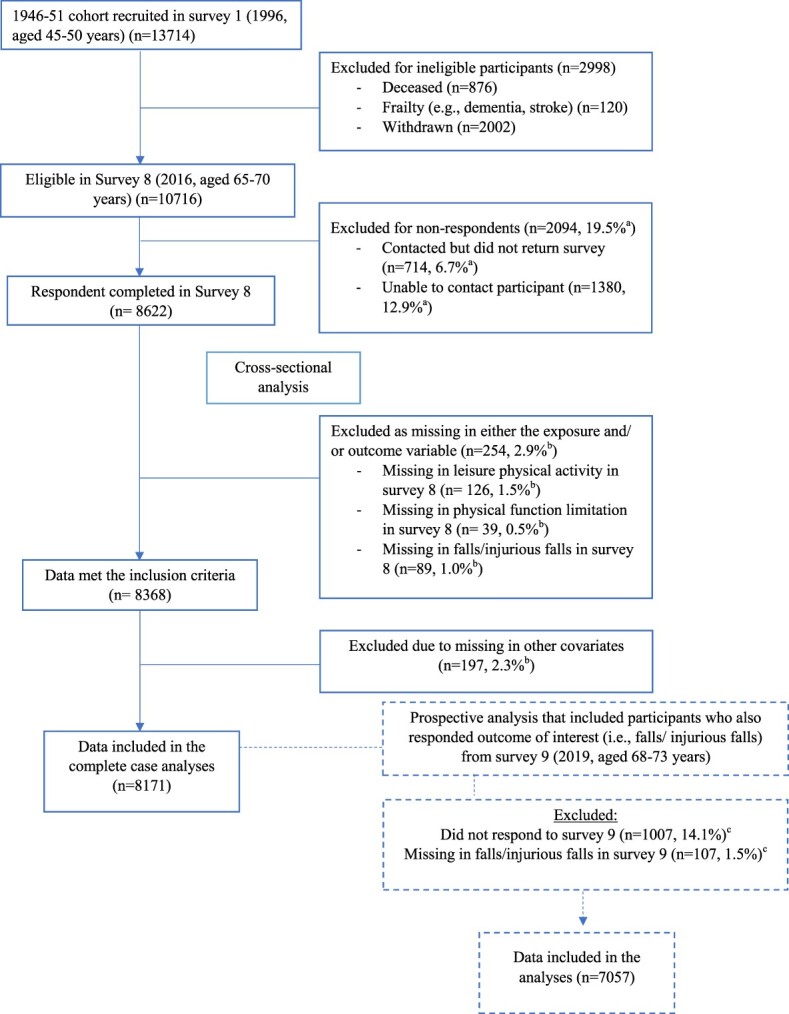
Figure 1.

Sample selection flowchart. aThe percentage was calculated based on the number of participants eligible in survey 8 (2016) (n = 10,716). bThe percentage was calculated based on the number of participants completed survey 8 (n = 8,622). cThe percentage was calculated based on the number of participants responded to both survey 8 and survey 9 (2019) (n = 7,164).
