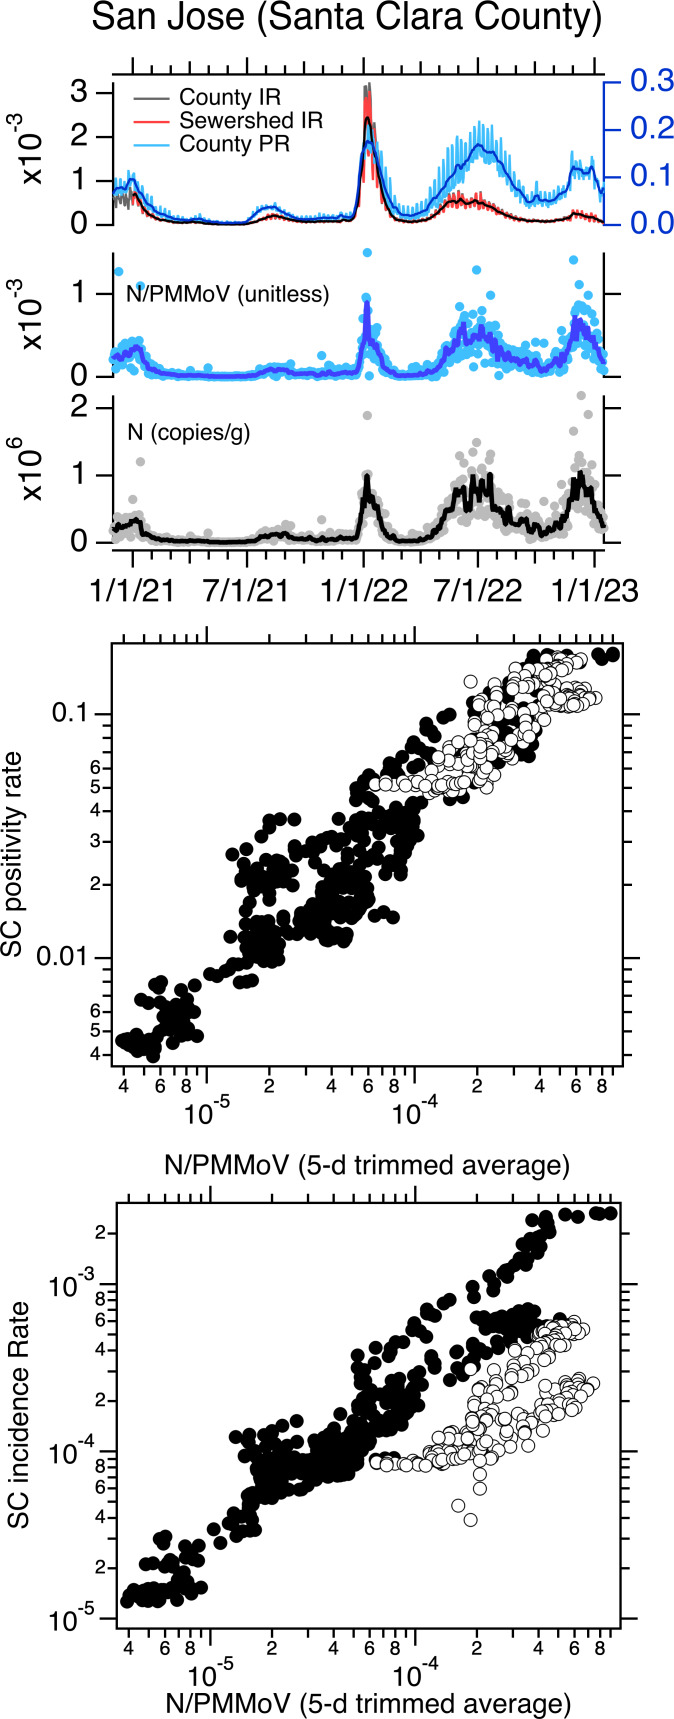
Figure 3. Data for San Jose POTW.
Top panel: San Jose (SJ) time series of concentrations of N and N/PMMoV in wastewater, incidence rates (IRs), and positivity rates (PRs) between 1 December 2020 until 16 January 2023. IRs and PRs are unitless. The solid lines represent 5-d trimmed averages for the wastewater data, and 7-d moving averages for the incidence and positivity rates. The county-aggregated and sewershed-aggregated incidence rate data fall almost directly on top of each other, obscuring the view of both. The scales for incidence and positivity rates are on the left and right axes, respectively. Middle and bottom panels: County-aggregated (Santa Clara County, SC) Positivity rate and incidence rate versus 5-d trimmed N/PMMoV; white symbols are data collected on and after 1 May 2022.

