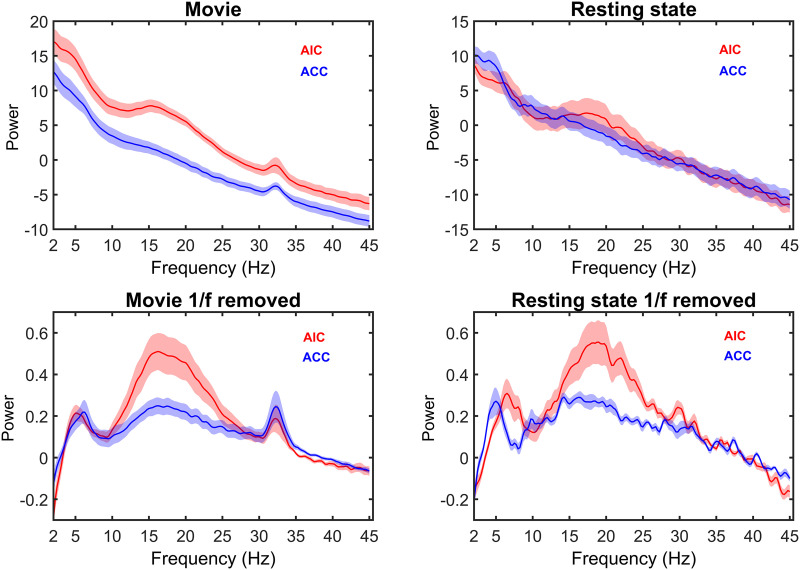
Figure 4. .
Power spectra. Power profiles of AIC and ACC activity during movie viewing (left) and resting state (right). The bottom row shows the power spectrum after correcting for 1/f power decay. During movie viewing, both the AIC and ACC showed a peak at 30–35 Hz (gamma range). The gamma peak was absent at rest. Shading denotes standard error of mean.

