Figure 5. .
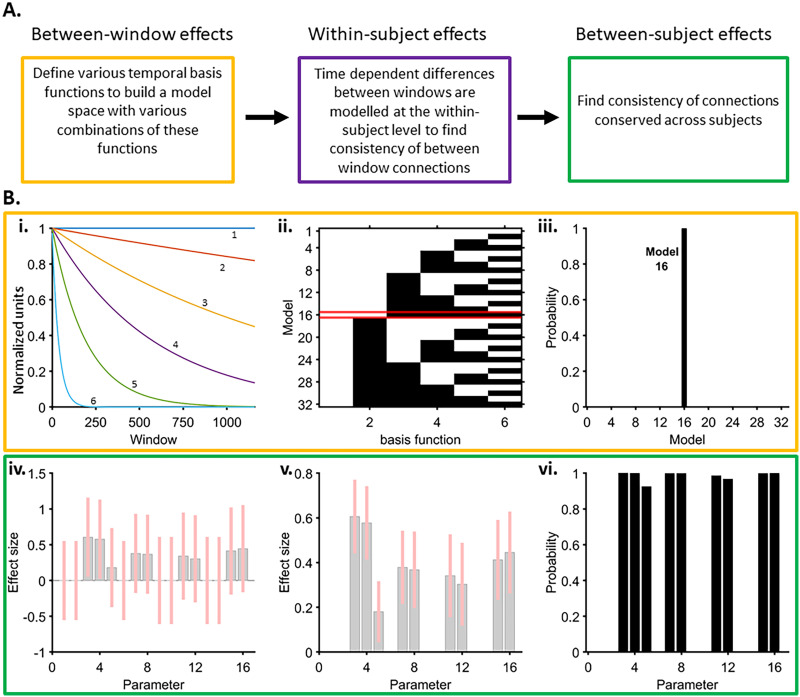
Multilevel parametric empirical Bayes (PEB) analysis of effective connectivity parameters. (A) Overview of the nested PEB analyses. (B i) Regressors [a constant term (1) and five temporal basis functions (2, 3, 4, 5, 6)] considered in a Bayesian general linear model to estimate between-window consistency of effective connectivity parameters. These regressors were selected to cover a wide range of possible neural mass decays. (ii) Model space with all possible combinations of the five temporal basis functions (with the constant term always included). White tiles indicate the presence of temporal basis functions in the model and the black tiles indicates their absence in the model. The winning model (16) is highlighted in red. (iii) Probability of winning model with Bayesian model comparison of all models. The winning model is highlighted in red and comprised of a combination of the constant term and three temporal basis functions (2 in panel A). (iv and v) Group-PEB analysis to identify between-window effects of specific connections conserved over participants without (iv) and with (v) greedy search, respectively. The plots show the connectivity parameters corresponding to models with the constant term (parameters 1–8), and each of the one winning temporal basis function (parameters 9–16) and the related effect sizes. Pink bars denote 90% Bayesian confidence intervals. (vi) Parameters reaching a posterior probability of >90% included feedforward connections (parameters 3, 4, 11, 12) and feedback connections (parameters 5, 7, 8, 15, 16). Only these connectivity parameters were used for further analysis.

