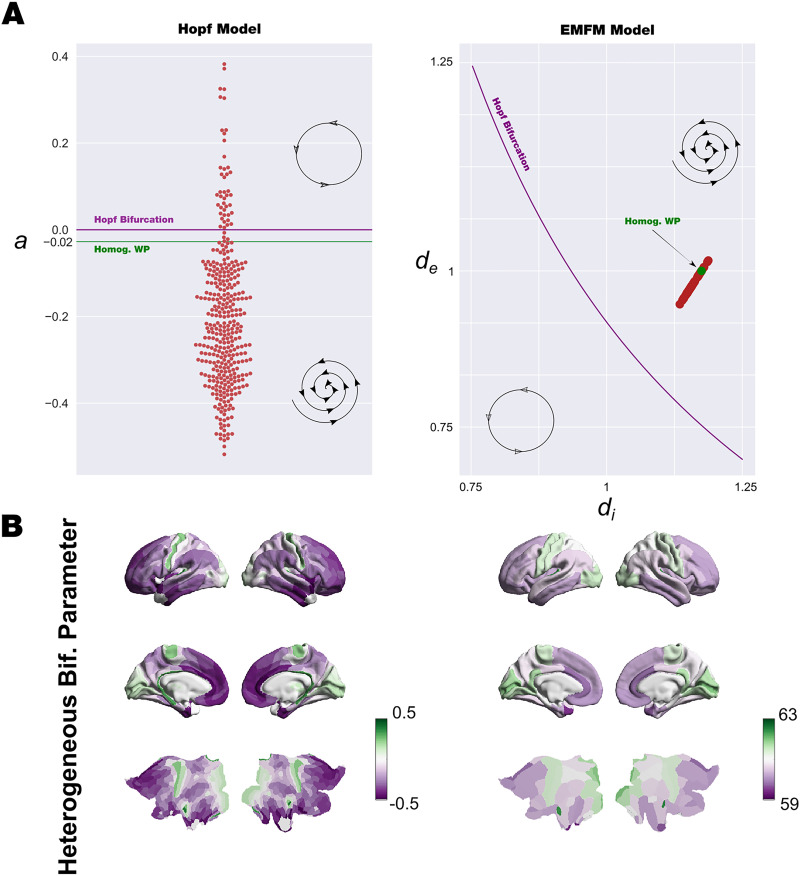
Figure 4. .
Heterogeneous bifurcation parameters. (A) We obtained the bifurcation parameters for both models shaped by the scaling and bias obtained from the heterogenous fitting optimization procedure described in previous figures. The left panel shows the Hopf whole-brain model organization of the heterogenous bifurcation parameter: a value for each node (red circles), with respect to the Hopf bifurcation point, a = 0 (purple line) and the homogenous value, a = −0.02 (green line). The right panel shows the exact mean-field whole-brain model organization of the bifurcation parameters de and di. Red circles show the values of de and di for each node, the bifurcation line is indicated in purple, and the homogeneous optimal working point is indicated in green. (B) The values of heterogeneous bifurcation parameters are rendered onto a brain cortex. The left panel shows the bifurcation parameter a of the Hopf whole-brain model, and the right panel shows the norm of the vector defined by each (de; di) pair. The same brain areas in both models are shifting toward high values and low values; nevertheless, the distribution with respect to the bifurcation point shows different behavior.

