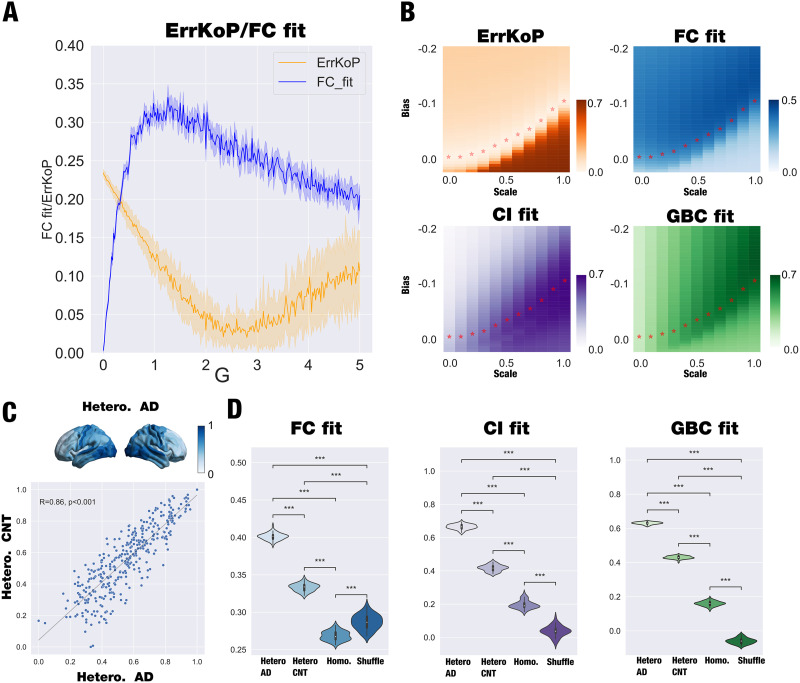
Figure 5. .
Hopf whole-brain model and the impact of regional functional heterogeneity in Alzheimer’s disease patients. (A) The homogeneous model (a = −0.02 for all nodes) was fitted to the empirical data by computing the correlation between model and empirical functional connectivity (FCfit, blue) and absolute error of the model and empirical Kuramoto order parameter (ErrKoP, orange) as a function of the global coupling parameter, G. We considered the model’s optimal working point to be the minimum of ErrKoP reached at G = 2.8. (B) Using the optimal working point found for the homogeneous model, we introduced regional heterogeneity and assessed its impact by exploring the two-dimensional space determined by the bias and the scaling that directly modify the regional bifurcation parameters. We computed four different fitting measures: the ErrKoP and FCfit; and the global brain connectivity fit (GBC) and the error in a proxy of Granger causality (CIfit), both computed as the Pearson correlation between the empirical and simulated measures. We defined an iso-level curve of ErrKoP, represented by red stars in the four matrices, computed as the value of bias that reaches the minimum value of ErrKoP for each value of scaling. (C) We rendered onto a brain the AD-specific regional heterogeneity (upper panel), and we then presented the high correlation between regional functional heterogeneities of patients and controls (lower panel). (D) We selected the scale value where the maximal CIfit is reached and computed 50 times the CIfit, FCfit, and the GBCfit with the functional AD-specific disease heterogeneity, healthy functional specific heterogeneity, the homogeneous model, and a spatial null model (generated by shuffling the regions of heterogeneity, preserving the autocorrelation). The violins show the comparison of the four models in the three measures, presenting statistical significance for all the cases (*** P < 0.001, Wilcoxon rank sum test with Bonferroni correction).

