Figure 3. .
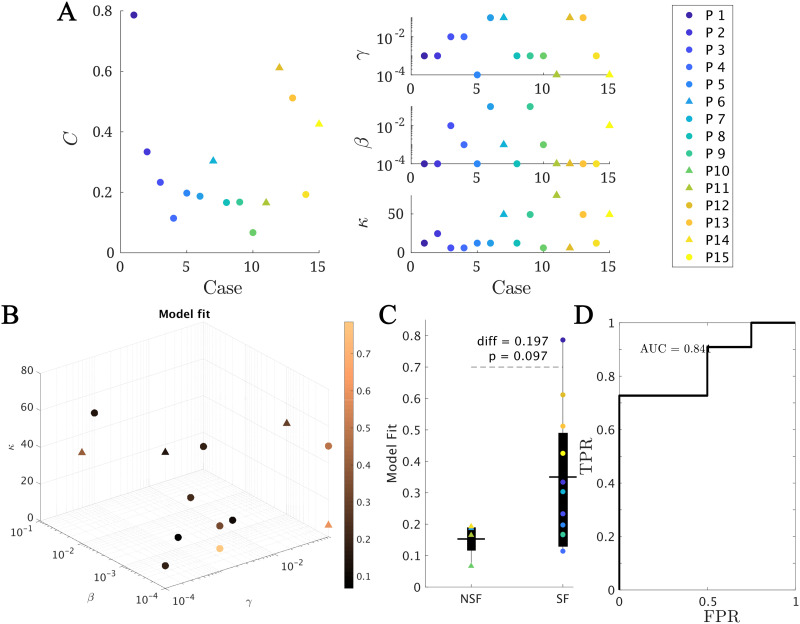
Model fitting results. (A and B) The best fit found for each patient. In panel A, the main (left) panel shows the resulting model fit (as given by the total correlation C) and the three small panels (right) show the corresponding fit parameters (κ, β, γ). Each patient is shown in a different color as indicated by the main legend, and SF and NSF patients are, respectively, indicated by circles and triangles. In panel B the model parameters (κ, β, γ) form the three axes of the plot and the color code indicates the goodness of fit C. We note that some points overlap. (C) Group comparison of the goodness of fit, for the NSF and SF groups (unpaired t test). Each color represents a different patient, as indicated by the main legend. The solid lines on each box indicate the mean values. In panels A and B, SF (NSF) patients are indicated by circles (triangles). (D) Receiver operating characteristic (ROC) curve corresponding to the group classification according to the goodness of fit. A positive result was defined as a good outcome (SF). FPR indicates the false positive rate (NSF patients classified as SF), and TPR the true positive rate (SF patients classified as SF).

