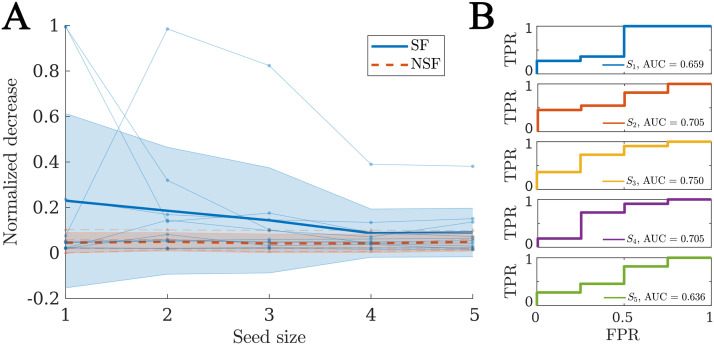
Figure 7. .
Virtual resection analysis. (A) Normalized decrease in spreading after disconnection of the resection area δR for seeds of increasing sizes. Each data point indicates an individual patient, blue circles stand for SF patients, and red triangles for NSF patients. The thick lines indicate the average values for each group, respectively, solid blue lines for the SF group and dashed red lines for the NSF group. The shaded areas indicate the uncertainty as given by the standard deviation. (B) ROC classification analysis for SF versus NSF outcome, for each considered seed size as indicated in the legends.

