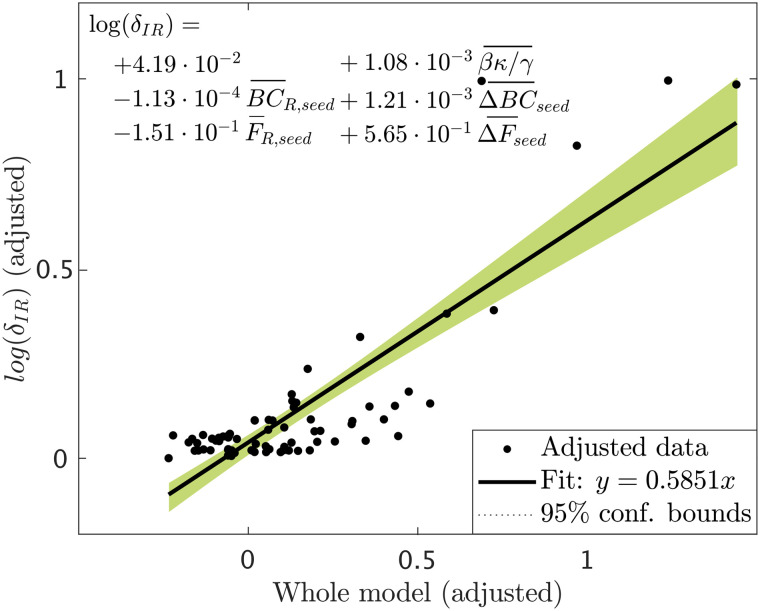
Figure 8. .
Added variable plot (partial regression leverage plot) of the linear regression model resulted from the stepwise regression analysis. Data points indicate the adjusted response values against the adjusted predictor variable values, the solid line indicates the adjusted linear fit, and the shaded areas the 95% confidence intervals. The bars over the variable names indicate adjusted variables. The statistical details of the fit are: number of observations = 75, degrees of freedom df = 69, root mean squared error rmse = 0.118, determination coefficient r2 = 0.715, Adjusted r2 = 0.694, F-statistic vs. constant model = 34.5, p = 1.6 · 10−17.

