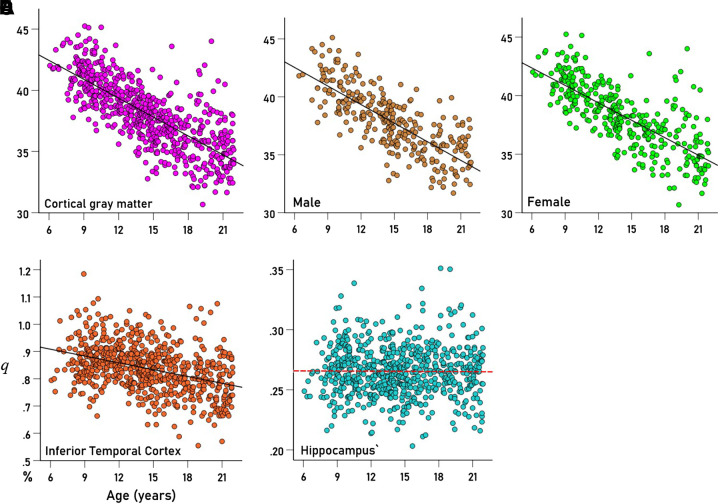
Figure 1.
Values of q (Eq. 2) of brain regions from individual participants are plotted against the age of the participant. Lines are fitted linear regression fits. A: cerebrocortical gray matter (all brains, n = 649). B: same region for males (n = 299). C: same region for females (n = 350). D: inferior temporal cortex, all brains (n = 649). E: hippocampus, all brains (n = 649). Relevant statistics for the plots are given in Table 1.

