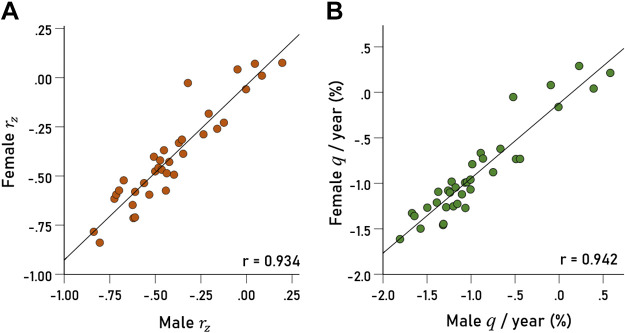
Figure 3.
A: Fisher z-transformed correlations rz of 35 q vs. years linear regression fits (one for each area) in females are plotted against the corresponding rz values of males. For each regression analysis, n = 350 and 299 for females and males, respectively. B: changes of q/yr (%) in 35 areas in females are plotted against the corresponding changes in males. See text for details.

