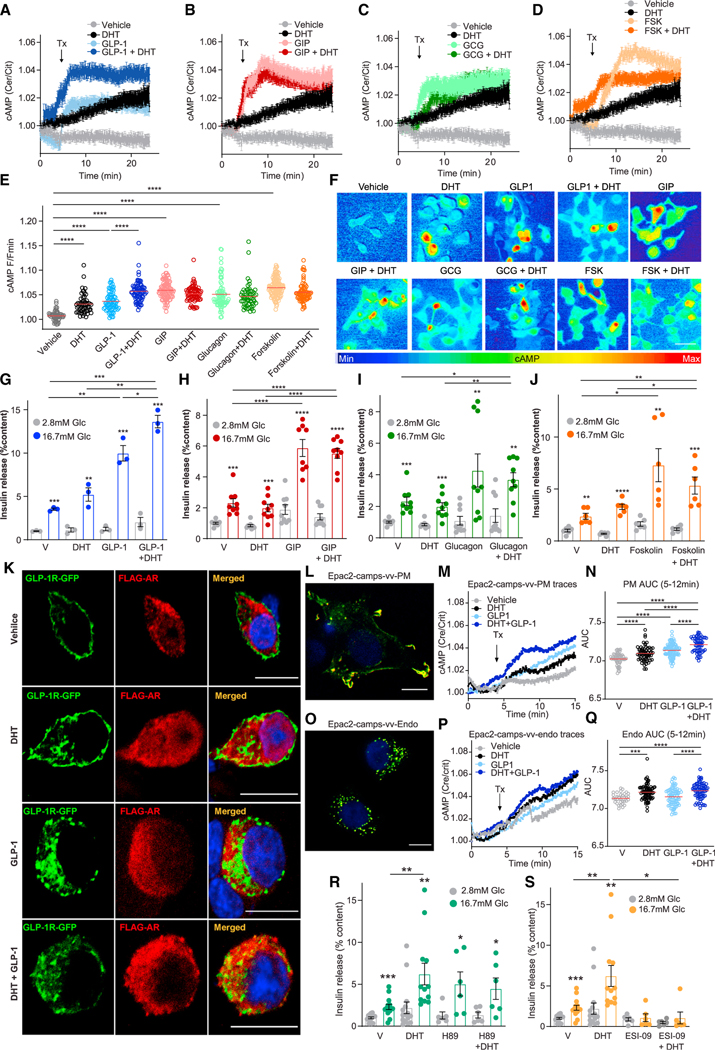
Figure 2. DHT amplifies GLP-1-stimulated cAMP production at the plasma membrane and endosomes.
(A–E) 832/3 cells were infected with adenovirus harboring the FRET Epac2 camps probe and treated with DHT (10 nM) in the presence of (A) GLP-1 (10 nM), (B) GIP (100 nM), (C) glucagon (20 nM), and (D) forskolin (FSK, 10 μM) starting at the indicated time (Tx arrow, 5 min). cAMP production was monitored in real time from live cells at single-cell resolution. The same control trace is shown in (A) to (D) for all experiments. Traces represent mean ± SE from all cells imaged over six independent replicates (i.e., 180–240 cells per state). (E) Summary graph showing amplitude of cAMP responses from (A) to (C) of six independent experiments, each with 30–40 cells/treatment imaged at single-cell resolution.
(F) Representative pictures from (A) to (E). Scale bar, 20 μm.
(G–J) GSIS in static incubation in 832/3 cells treated with vehicle, DHT (10 nM) in the presence of (G) GLP-1 (10 nM), (H) GIP (100 nM), (I) glucagon (20 nM), and (J) forskolin (100 nM) for 40 min. Values represent the mean ± SE of n = 3 independent wells and 3–8 independent experiments.
(K) INS1 832/3 cells were transfected with GLP-1R-GFP (green) and FLAG-AR (red) and treated with vehicle, DHT (10 nM), GLP-1 (10 nM), and DHT + GLP-1 for 15 min. Receptor localization was assessed by immunofluorescence.
(L–Q) Chinese hamster ovarian (CHO-K1) cells were transfected with cAMP biosensors, (L) PM-TEpacVV (plasma membrane localized) or (O) Endo-TEpacVV (endosomally localized), and images were captured by confocal microscopy 24 h after transfection. Note peripheral distribution for the plasma membrane biosensor and punctate pattern for the endosomal biosensor. Scale bars, 10 μm. (M, N, P, and Q) 832/3 cells were transfected with PM-TEpacVV or Endo-TEpacVV plasmids and treated with DHT (10 nM), GLP-1 (10 nM), and DHT + GLP-1 (n = 4 independent replicates, 55–103 cells). (M and P) cAMP production was monitored in real time from live cells imaged at single-cell resolution, with treatment starting at the indicated time (Tx arrow, 5 min). (N and Q) AUC of the cAMP peak between 5 and 12 min.
(R and S) GSIS was measured in static incubation in male human islet donors (10 islet equivalents [IEQ]/condition measured in 3–6 replicates and two human donors) treated with vehicle, DHT (10 nM) for 40 min in the presence or absence of (R) the PKA inhibitor H89 (10 mM) or (S) EPAC inhibitor ESI-09 (10 μM).
Values represent the mean ± SE. *p < 0.05, **p < 0.01, ***p < 0.001, ****p < 0.0001.

