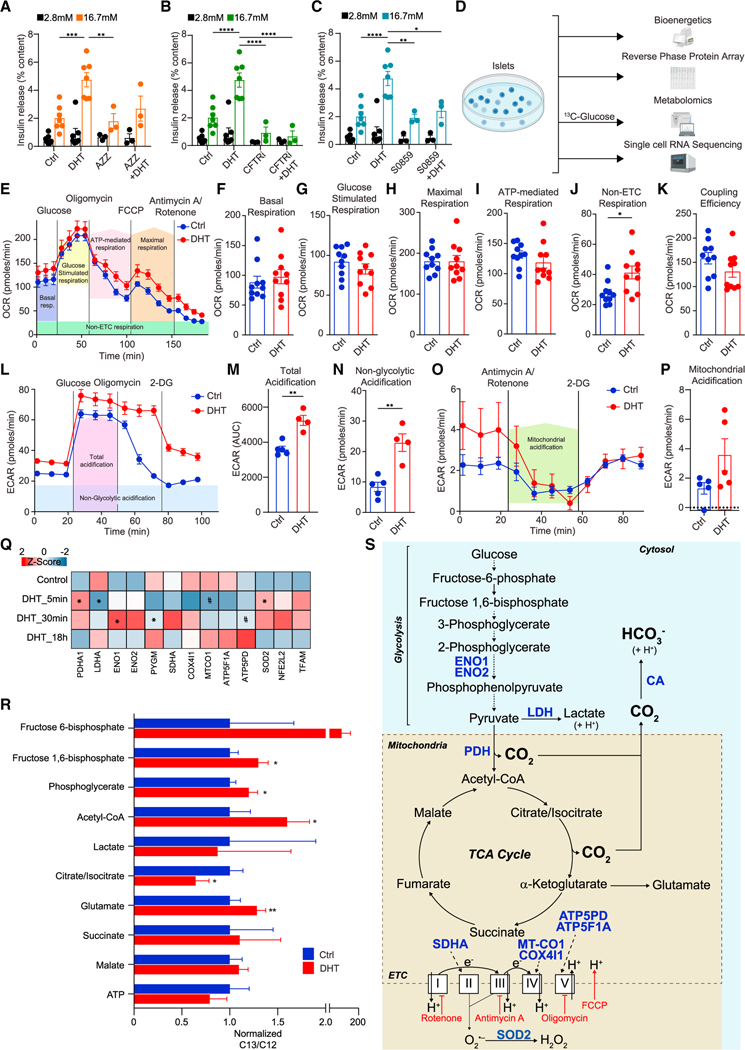
Figure 4. DHT increases glucose metabolism and bicarbonate production.
(A–C) GSIS was measured via static incubation in male human islets (n = 3–7 donors, 10 IEQ/condition measured in triplicate) cultured for 24 h with vehicle or DHT (10 nM) and then for 40 min in the presence or absence of (A) a carbonic anhydrase inhibitor AZZ (50 μM), (B) CFTR inhibitor CFTRi (500 μM), or (C) NA+/HCO3− co-transporter inhibitor S0859 (2 μM).
(D) Schematic representation of bioenergetics, metabolomics, proteomics, and transcriptomics workflow.
(E–K) Oxygen consumption rate (OCR) was measured in male C57/BL6 mouse islets treated with vehicle or DHT (10 nM) in a Seahorse analyzer during a mitochondrial stress test using oligomycin, FCCP, and antimycin A/rotenone at the indicated times. Islets were pooled from 10 mice with 150 islets per well in 10 wells for each condition and n = 3 experiments. (E) Line graph of OCR showing the key parameters of mitochondrial function measured in (F) to (K).
(L–P) Extracellular acidification rate (ECAR) was measured in a Seahorse analyzer during (L–N) a glycolytic stress test using 2-DG and (O and P) a mitochondrial stress test using antimycin A/rotenone at the indicated times. Islets were pooled from 5 mice with 150 islets per well in 5 wells for each condition and n = 2 experiments.
(Q) Human islets (n = 3 donors, 1,200 IEQ/condition) were treated with DHT for 5 min, 30 min, and 18 h, compared with control untreated islets, and studied by reverse-phase protein array (RPPA). Normalized values from the three individual donors were averaged to generate an average Z score and map proteins in the heatmap. *p < 0.05 (t test) and #p < 0.05 (Fisher’s LSD test) compared with control.
(R) Human islets (n = 3 donors, 500 IEQ/condition) were treated with DHT at 16.7 mM glucose for 30 min in the presence of [13C]glucose, and metabolites were measured by LC-MS. Results represent the mean ± SE of the ratio 13C/12C metabolite abundance.
(S) Schematic representation of the pathway, enzymes, and metabolites described in (A) to (R).
Values represent the mean ± SE. *p < 0.05, **p < 0.01, ***p < 0.001, ****p < 0.0001.

