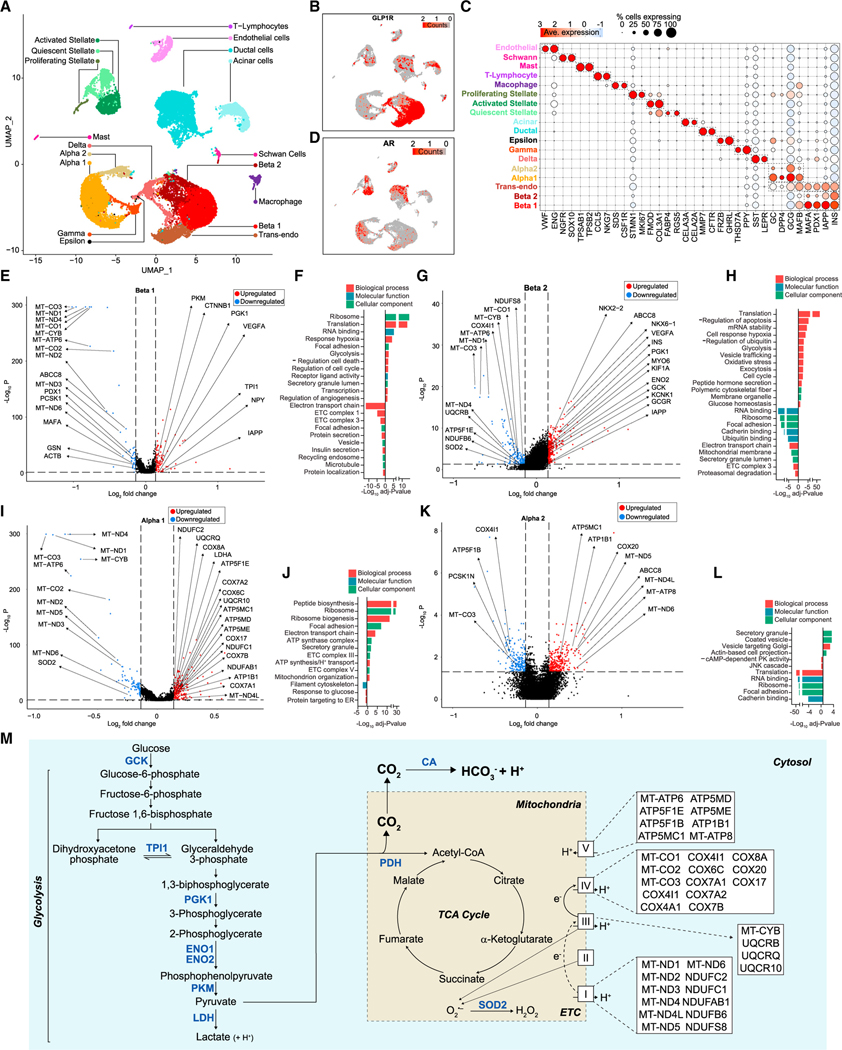
Figure 5. DHT-stimulated human islet a and b cell transcriptome involved in glycolysis and TCA cycle.
(A) Human islets (750 IEQ/condition) were cultured for 24 h with vehicle and DHT and single-cell RNA sequencing. Data represent a multiple-donor integrated multidimensional uniform manifold approximation projection (UMAP) plot. The plot shows 28,809 single cells where each dot represents the transcriptome of a single cell. Clusters of characteristic cell types on the basis of their transcriptional footprint are color coded and labeled.
(B) UMAP plot of data classified in (A) showing the expression of GLP-1R transcripts across individual islet cells.
(C) Dot plot showing the percentage of cells across each cluster expressing cell-type-specific genes.
(D) UMAP plot of data classified in (A) showing the expression of AR transcripts across individual islet cells.
(E) Volcano plot showing differentially expressed genes (DEGs) for DHT vs. vehicle treatment in the Beta 1 cluster. Blue, genes with FDR < 0.05 and log2 fold change < −0.137; red, genes with FDR < 0.05 and log2 fold change > 0.137; black, genes below both thresholds.
(F) Bar plot showing enriched gene ontology (GO) pathway terms for the DEGs shown in (E).
(G–L) (G) Volcano plot showing DEGs for DHT vs. vehicle treatment in the Beta 2 cluster, as in (E). (H) Bar plot showing enriched GO pathway terms for the DEGs shown in (G). (I) Volcano plot showing DEGs for DHT vs. vehicle treatment in the Alpha 1 cluster, as in (E). (J) Bar plot showing enriched GO pathway terms for the DEGs shown in (I). (K) Volcano plot showing DEGs for DHT vs. vehicle treatment in the Alpha 2 cluster, as in (E). (L) Bar plot showing enriched GO pathway terms for the DEGs shown in (K).
(M) Schematic representation of the effect of DHT on glycolysis and TCA cycle genes and pathways described in (E) to (L).
Data represent n = 3 donors. Values represent the mean ± SE. *p < 0.05, **p < 0.01, ***p < 0.001, ****p < 0.0001.

