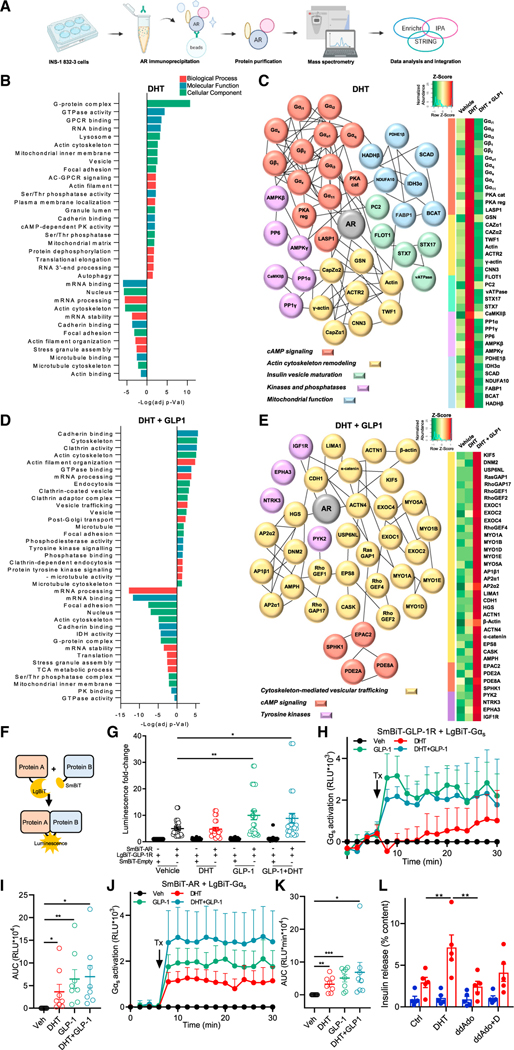
Figure 6. DHT and GLP-1 collaborate to promote GLP-1R and AR recruitment of Gαs.
(A) Schematic representation of immunoprecipitation-based proteomics analysis workflow.
(B–E) IP-based proteomics analysis was performed in INS1 832/3 cells treated with DHT (10 nM) or vehicle overnight followed by DHT in the presence or absence of GLP-1 (10 nM) for 5 min. (B) GO enrichment analysis of DHT-treated cells using Enrichr. Bar plot shows DHT-stimulated AR interactions with proteins over- or under-represented in the indicated pathways. (C) DHT-stimulated AR interactome (left) and corresponding heatmap (right) were constructed by integrating the GO, IPA, and STRING analyses. (D) GO enrichment analysis of DHT + GLP-1-treated cells using Enrichr. Bar plots shows DHT-and GLP-1-stimulated AR interactions with proteins over-or under-represented in the indicated pathways. (E) DHT -and GLP-1-stimulated AR interactome (left) and corresponding heatmap (right) were constructed as in (C).
(F) Schematic representation of the concept of SmBiT and LgBiT interactions resulting in luminescence.
(G) Luminescence of INS1 832/3 cells transfected with plasmids for SmBiT-AR, LgBiT-GLP-1R, or empty vector SmBiT-Empty and treated with DHT (10 nM) GLP-1 (10 nM), or both, for 20 min.
(H) INS1 832/3 cells were transfected with SmBiT-GLP-1R and LgBiT-Gαs. After basal measurements for 6 min, cells were treated (Tx) with DHT, GLP-1, or both for 22 min. Measurements were taken every 2 min. Line graph shows Gαs recruitment to GLP-1R.
(I) AUC for (H).
(J) INS1 832/3 cells were transfected with SmBiT-AR and LgBiT-Gαs and treated with DHT (10 nM) or GLP-1 (10 nM) as in (H). Line graph shows Gαs recruitment to GLP-1R.
(K) AUC for (J).
(L) GSIS was measured in static incubation in male human islets (5 donors, 10 IEQ/condition measured in triplicate) treated with vehicle, DHT (10 nM) for 40 min in the presence of absence of the tmAC inhibitor ddAdo (1 μM).
In (G) to (K), AR and GLP-1R interaction assays were performed in n = 12 biological replicates. Gαs recruitment assays were performed in n = 6 biological replicates. Values represent the mean ± SE. *p < 0.05, **p < 0.01, ***p < 0.001, ****p < 0.0001.

