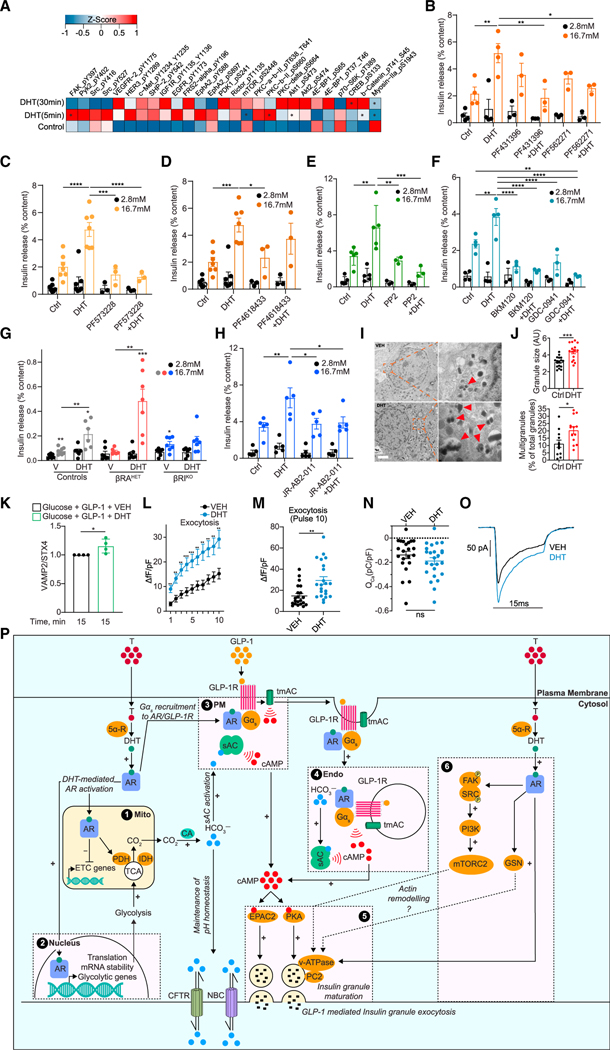
Figure 7. AR-activated pathway promoting glucose-stimulated actin remodeling and exocytosis.
(A) Human islets (n = 3 donors, 10 IEQ/condition) were treated with DHT for 5 min, 30 min, and 18 h, compared with control untreated islets, and studied by RPPA. Normalized values from the three individual donors were averaged to generate an average Z score and map phosphoproteins in the heatmap. *p < 0.05 (t test). (B–H) GSIS was measured in static incubation in male human islets (10 IEQ/condition measured in triplicate) cultured for 24 h with vehicle or DHT (10 nM) followed by 40 min with DHT in the presence or absence of the following inhibitors: (B) dual FAK and PYK2 inhibitors PF431396 (15 nM) and PF562271 (15 nM) (n = 3–5 donors), (C) selective FAK inhibitor PF573228 (10 nM) (n = 3–7 donors), (D) selective PYK2 inhibitor PF4618433 (1 μM) (n = 3–7 donors), (E) SRC kinase inhibitor PP2 (1 μM) (n = 3–5 donors), (F) PI3K inhibitors BKM120 (1 μM) and GDC-0941 (1 μM) (n = 3–4 donors), and (H) mTORC2 inhibitor JR-AB2–011 (5 μM) (n = 5 donors). (G) GSIS was measured in static incubation in islets treated with vehicle or DHT (10 nM) for 40 min from male control (RIP-Cre), βRAHET, and βRAKO mice (n = 7 mice, with each condition measured in triplicate, n = 10 islets per replicate),.
(I) Representative transmission electron micrographs of human islet β cell treated with vehicle (left) and DHT (right). Insets highlight insulin granules, where red arrows show multigranules. Scale bar, 1 μm.
(J) (Top) Quantification of insulin granule size. (Bottom) Quantification of percentage of insulin multigranules over total insulin granules/cell across n = 3 donors (I and J) and 15 cells.
(K) Plasma membrane content of VAMP2 normalized for STX4 in INS-1 832/3 cells treated with DHT (10 nM).
(L and M) Insulin exocytosis measured by change in capacitance (fF) from human islet β cells with DHT (10 nM) applied via patch pipette in the presence of cAMP (100 μM) (n = 22 cells per treatment). Changes in fF are normalized to cell size (pF).
(N and O) Calcium current measured in human islet b cells with DHT (10 nM) applied via patch pipette in the presence of cAMP (100 μM) (n = 22 cells per treatment). Calcium current (ICa), calcium influx (QCa), and calcium influx (pC) are normalized to cell size (pF).
(P) Schematic representation of proposed mechanism. (1 and 2) DHT-activated AR pools in the PM vicinity, mitochondria (mito), and nucleus program glycolysis and TCA cycle, increasing CO2 production, which is converted to HCO3− via carbonic anhydrase (CA). HCO3− activates the sAC at (3) the PM and (4) endo while CFTR and NBC promote HCO3− efflux to maintain pH homeostasis. In parallel, DHT-activated AR pools at the (3) PM and (4) endo collaborate with ligand-activated GLP-1R to promote Gαs recruitment to AR and GLP-1R complexes and activate tmAC. Together, this results in DHT enhancing GLP-1-mediated cAMP production at the PM and endo, which (5) activates cAMP-dependent effectors PKA and EPAC2 to promote insulin granule exocytosis. (6) DHT-activated AR in the PM vicinity activates a signaling cascade including FAK/SRC/PI3K/mTORC2 that further enhances insulin granule exocytosis. AR-DHT may also promote actin remodeling via gelsolin (GSN).
Values represent mean ± SE. *p < 0.05, **p < 0.01, ***p < 0.001, ****p < 0.0001.

