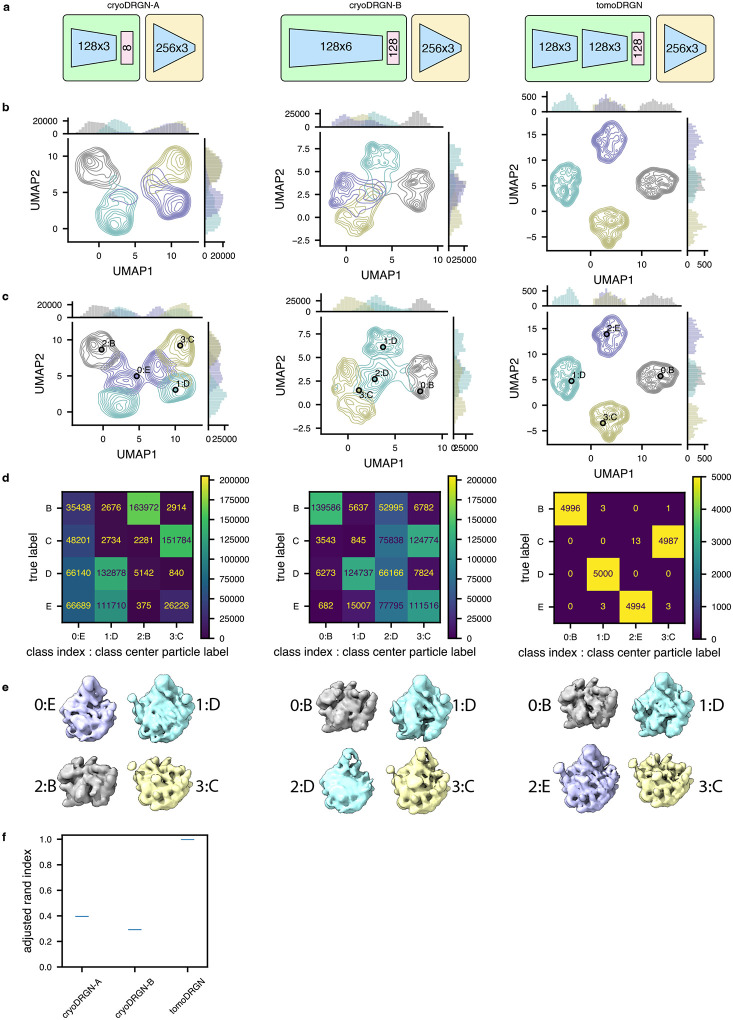
Extended Data Figure 7: CryoDRGN fails to consistently encode structural heterogeneity using a simulated tilt series dataset.
(a) Schematic of two cryoDRGN network architectures that were tested, and the tomoDRGN architecture used in Fig. 2c–e. Each model was trained using the same simulated dataset of ribosome large subunit assembly classes B-E (Davis et al., 2016) consisting of 41 tilt images for each of 5,000 particles for each of the four assembly states and thus the dataset was treated by cryoDRGN as n=820,000 images (see Methods).
(b) UMAP of final epoch latent embeddings of each particle image, represented as a kernel density estimate (KDE) is plotted, with KDEs independently estimated and plotted for each of the four ground truth assembly states (bottom).
(c) UMAP of final epoch latent embedding with k=4 k-means latent classification of the resulting latent space. KDEs were independently estimated and plotted for each of the four k-means classes. The predicted labels are annotated by both the k-means class index (0–3) and corresponding ground truth class label (B-E) of the central particle within each k-means class.
(d) Confusion matrix of ground truth class labels versus k=4 k-means latent classification.
(e) Volumes sampled at the k=4 k-means cluster centers illustrated in (c). Volumes are annotated by the k-means class index and ground truth class label and colored by the ground truth class label.
(f) Violin plot of consistency of k=4 k-means clustering of each model by Adjusted Rand Index (Hubert and Arabie, 1985) (n = 100 randomly seeded initializations, higher values correspond to greater fidelity to ground truth classification).

