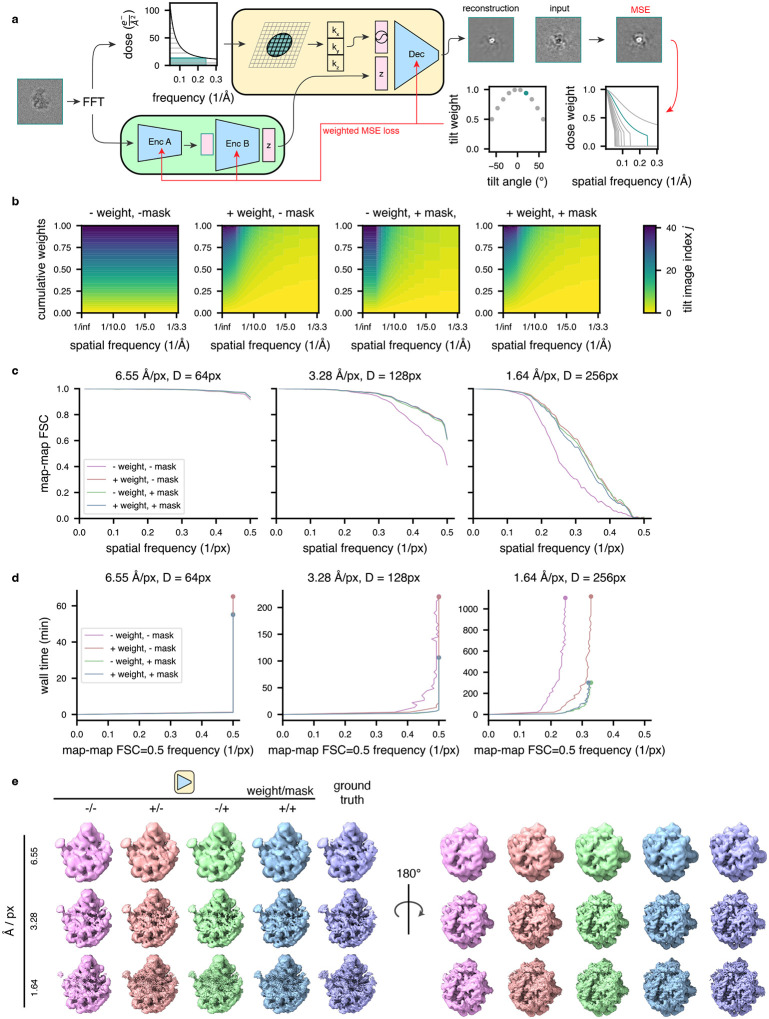
Extended Data Figure 1: Training on a weighted subset of pixels improves reconstruction quality and compute performance.
(a) Graphical overview of the dose filtering scheme (applied upstream of the decoder) and dose and tilt weighting scheme (applied during reconstruction error calculation) for a single representative tilt image. Filtering: the fixed optimal exposure curve is used to determine which spatial frequencies will be considered as a function of dose; the decoder processes only Fourier lattice coordinates within this mask (green lattice circle). Weighting: the squared error of the reconstructed Fourier slice is weighted per-frequency by the exposure-dependent amplitude attenuation curve and per-slice by the cosine of the corresponding stage tilt angle, before mean reduction and backpropagation (red arrows).
(b) Relative weight of each tilt image assigned to a particle’s reconstruction error during model training as a function of spatial frequencies (x-axis), and tilt and dose, which are colored yellow to blue from low-to-high dose and tilt angle, assuming a dose symmetric tilt scheme (Hagen et al., 2017).
(c) Map-map FSC of simulated class E large ribosomal subunit volumes (Davis et al., 2016) compared to tomoDRGN homogeneous network reconstructions in the presence or absence of the weighting or masking schemes at varying box and pixel sizes.
(d) Spatial frequencies corresponding to FSC=0.5 map-map correlation with the ground truth volume plotted against wall time for model training.
(e) Final tomoDRGN reconstructed volumes (left and center) and ground truth volumes (right) in the presence or absence of the weighting or masking schemes at box and pixel sizes assessed in panels (c) and (d).

