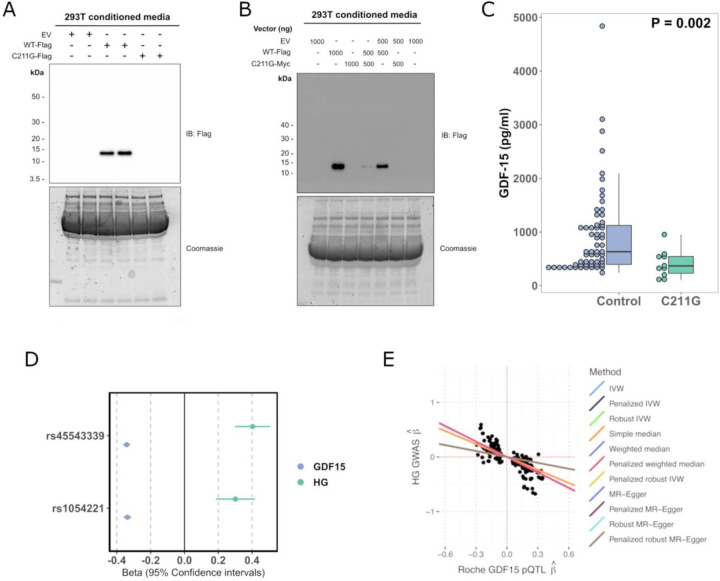
Figure 3. Rare and common hyperemesis gravidarum risk variants lower circulating GDF15 in the non-pregnant state.
A: We studied the secretion of a rare hyperemesis gravidarum risk variant GDF15 C211G. C211G impairs the secretion of GDF15 as determined by western blotting of cell culture medium of cells expressing Flag-tagged wild-type GDF15 (WT-Flag) or GDF15 C211G (C211G-Flag). B: GDF15 C211G impairs the secretion of wild-type GDF15 in a dominant negative manner as co-expression of the mutant inhibited secretion of wild-type GDF15 from 293T cells co-transfected with different amounts (shown in nanograms) of wild-type WT-Flag and Myc-tagged GDF15 C211G (C211G-Myc), as indicated. For A and B representative images from 3 independent experiments are presented. EV represents transfection with the empty plasmid backbone. C: Dot and box plots showing GDF15 levels measured using the Ansh Total GDF15 assay in carriers of GDF15 C211G variant (N=10) identified in an exome-sequencing study of a Croatian population and age and sex matched controls (N=60) derived from the same study. The P-value is from a linear regression model of natural log transformed GDF15 ~ C211G status. D: Forest plot illustrating the effect (standardised betas) of previously described HG risk SNPS on circulating GDF15 measured in 18,184 participants in the Generation Scotland Study. The effect estimates for the rs1054221 variant presented are from an analysis conditioned on the the lead HG variant rs45543339. The beta estimates for GDF15 represent the effect of the HG risk allele on circulating GDF15 in standard deviations. The beta estimates for HG (Hyperemesis Gravidarum) represent the effect of the SNP on risk of HG in log-odds. E: Scatterplot of HG GWAS effect estimates (ie log-odds) vs Roche-based GDF15 pQTL effect estimates derived from cis-Mendelian randomization at the GDF15 locus. MR was performed using m=259 SNPs with genome-wide evidence of pQTL effects on GDF15 levels within 1Mb GDF15 locus and adjusted using LD estimates from UK Biobank WGS individuals (n=138335; see Methods). Causal effect estimates obtained using LD-aware MR and reflected as regression lines.

