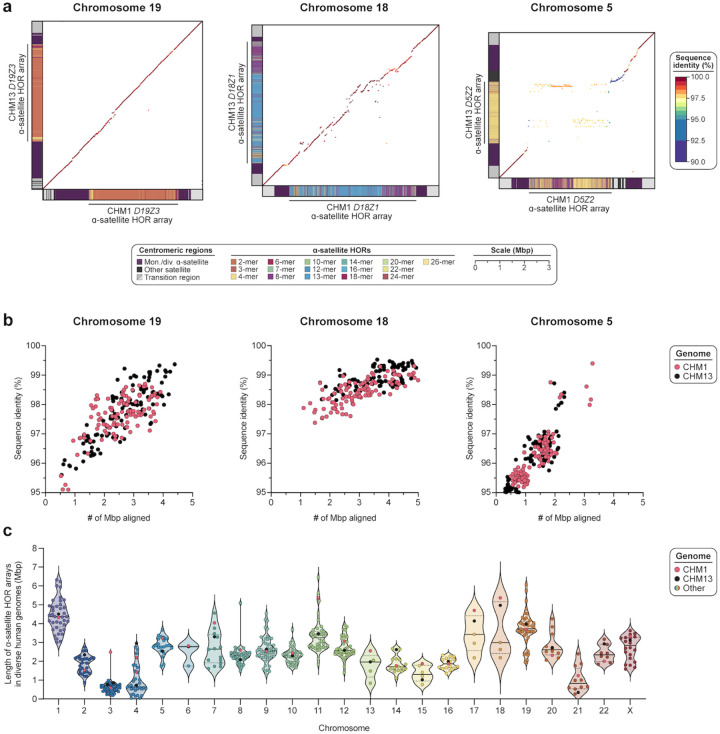
Figure 2. Variation in sequence and structure between two sets of human centromeres.
a) Dot matrix plots showing allelic variation between CHM1 and CHM13 centromeric/pericentromeric haplotypes. Diagonal lines are colored by % sequence identity. The α-satellite HOR structure is shown on the axes, along with the organization of each centromeric/pericentromeric region. b) Comparison of the % sequence identity and # of Mbp aligned for 112 human centromere haplotypes from the HPRC7 and HGSVC18 mapped to the complete CHM1 and CHM13 centromere assemblies. Note that each dot represents a haplotype with 1:1 best mapping, although many of the centromeres are not yet complete in the HPRC/HGSVC samples. c) Plot showing the length of the active α-satellite HOR arrays among the CHM1 (red), CHM13 (black), and complete HPRC/HGSVC centromeres (various colors); n = 626. The α-satellite HOR arrays range in size from 0.03 Mbp on chromosome 4 to 6.5 Mbp on chromosome 11. Mean, solid black bar; 25% and 75% quartiles, dotted black bars.

