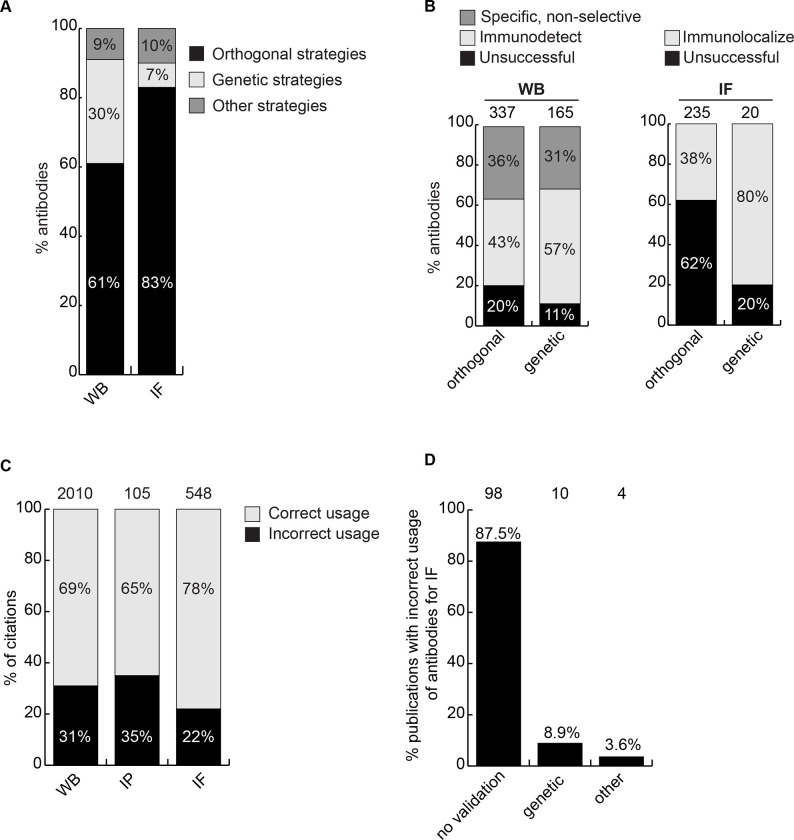
Figure 4: Scientific value of antibody characterization methods and research usage.
(A) Percentage of antibodies validated by suppliers using one of the indicated methods for WB or IF showed using a bar graph with stacked columns. The percentage corresponding to each section of the bar graph is shown directly in the bar graph. Orthogonal= orthogonal strategies, genetic= genetic strategies. (B) Percentage of successful (light gray), specific, non-selective (dark gray-only for WB) and unsuccessful (black) antibodies according to the validation method used by the manufacturer for WB and IF as compared to the KO strategy used in this study. Data are shown using a bar graph with stacked columns. The percentage corresponding to each section of the bar graph is shown directly in the bar graph. The number of antibodies analyzed corresponding to each condition is shown above each bar. (C) Percentage of publications that used antibodies that successfully passed validation (correct usage) or to antibodies that were unsuccessful in validation (incorrect usage) showed using a bar graph with stacked columns. The number of publications was found by searching CiteAb. The percentage corresponding to each section of the bar graph is shown in the bar graph and the number of publications represented in each category is shown above the corresponding bar. (D) Percentage of publications that used an unsuccessful antibody for IF from (C) that provided validation data for the corresponding antibodies. Data is shown as a bar graph. The number of publications represented in each category is shown above the corresponding bar.

