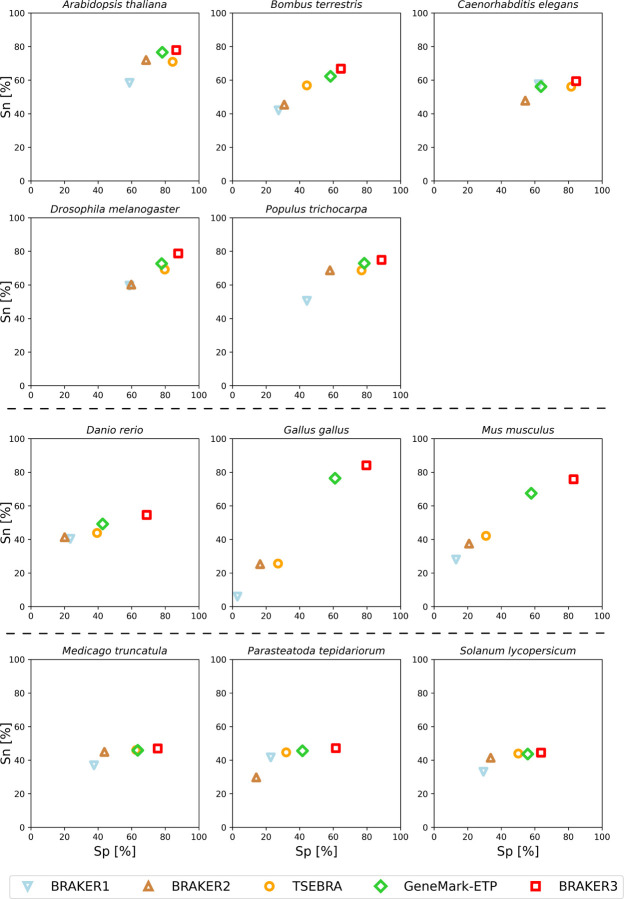
Figure 3:
Gene level specificity and sensitivity of gene predictions made by BRAKER1, BRAKER2, TSEBRA, GeneMark-ETP, and BRAKER3 for the genomes of 11 different species: well annotated and compact genomes (first and second row), well-annotated and large genomes (third row), other genomes (fourth row). Inputs were the genomic sequences, short-read RNA-Seq libraries, and protein databases (order excluded ).

