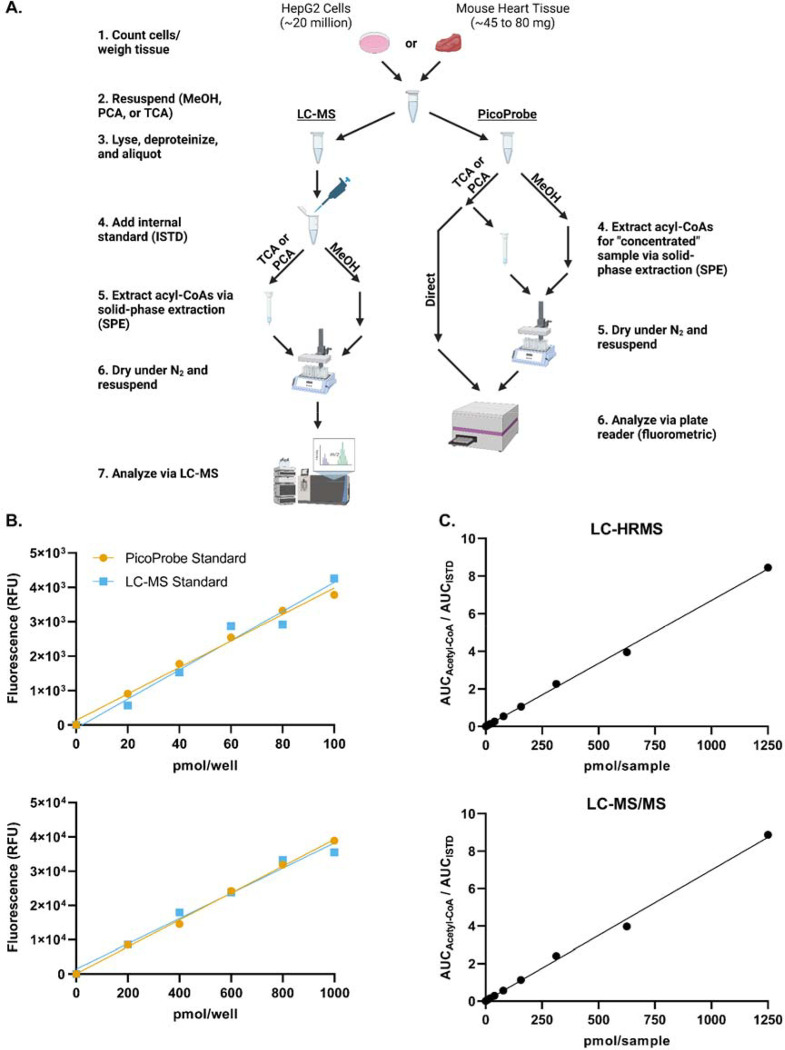
Figure 1. Method comparison schematic and calibration curves.
(A) Outline of the method comparison experiment.
(B) Standard curves were generated using the PicoProbe™ assay kit. The PicoProbe™ assay standards were prepared per the manufacturer’s recommendations. A set of standards also was prepared at the same concentrations using the stock standard used for the LC-MS assays.
(C) Standard curves were generated via LC-HRMS and LC-MS/MS.

