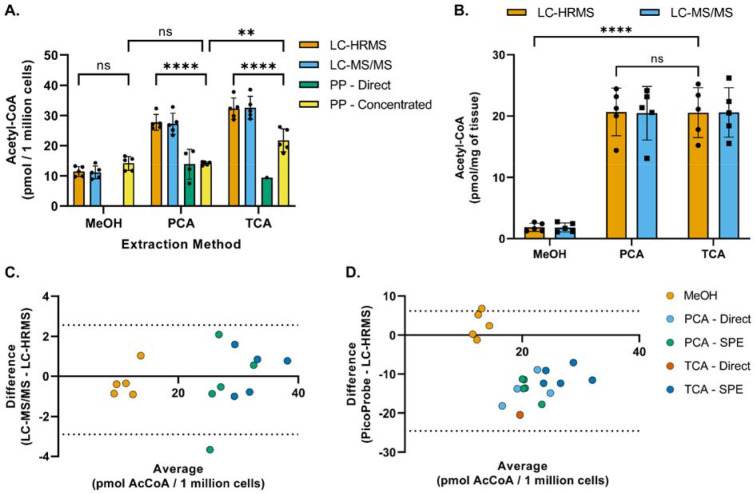
Figure 2. Method comparison of acetyl-CoA quantitation techniques and extraction methods.
(A) Acetyl-CoA was extracted from HepG2 cells using −80°C 80:20 methanol:water (MeOH), perchloric acid (PCA) or 10% trichloroacetic acid in water (TCA) as described in the methods section and then analyzed via LC-HRMS, LC-MS/MS, or the PicoProbe™ (PP) assay. Each symbol represents an individual replicate sample, and error bars represent standard deviations. Statistical comparisons were performed via two-way ANOVA with post-hoc Tukey’s correction for multiple comparisons. The “PP – Direct” data were excluded from statistical comparisons due to the lack of replicates exhibiting a signal above the lower limit of quantitation. For each extraction method, no statistical significance was observed between the means of the LC-MS techniques.
(B) Acetyl-CoA was extracted from heart tissue samples as described in the methods section and then analyzed via LC-HRMS or LC-MS/MS. For each extraction method, each symbol represents tissue from one of five different mice, and error bars represent standard deviations. Statistical comparisons were performed via two-way ANOVA with post-hoc Tukey’s correction for multiple comparisons. For each extraction method, no statistical significance was observed between the means of the LC-MS techniques.
(C and D) Bland-Altman plots comparing sample results generated via (C) the LC-MS/MS assay or (D) the PicoProbe™ assay to the sample results generated via the LC-HRMS assay.
**p≤0.01, ****p≤0.0001, ns = no significance

