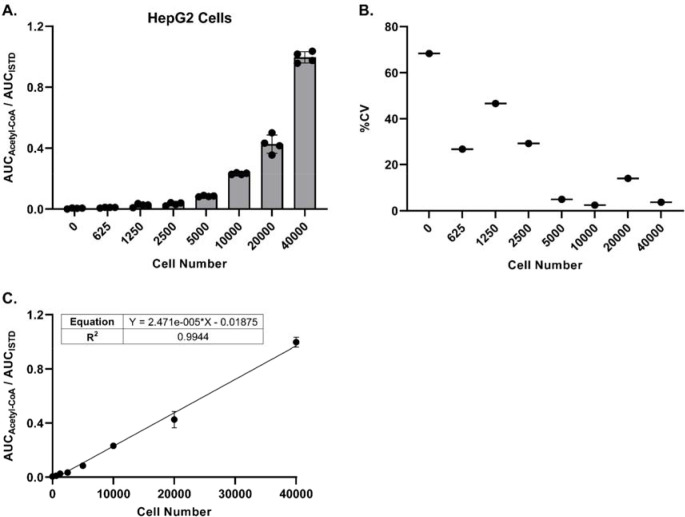
Figure 3. LC-HRMS analysis enables relative quantitation of acetyl-CoA at low cell numbers.
HepG2 cells were plated in a 96-well plate at various cell numbers (n=4 wells per cell number), incubated overnight, and processed directly for LC-HRMS analysis.
(A) Ratio of the peak area (AUC) of acetyl-CoA versus the peak area of the acetyl-CoA internal standard. Each symbol represents an individual replicate, and error bars represent standard deviations.
(B) Percent coefficient of variation of the individual replicates (n=4) at each cell number. Some replicates at the lower cell numbers did not have a detectable acetyl-CoA response.
(C) Linear regression of the peak area ratios. Each symbol represents the mean of individual replicates (n=4). Error bars represent standard deviations.

