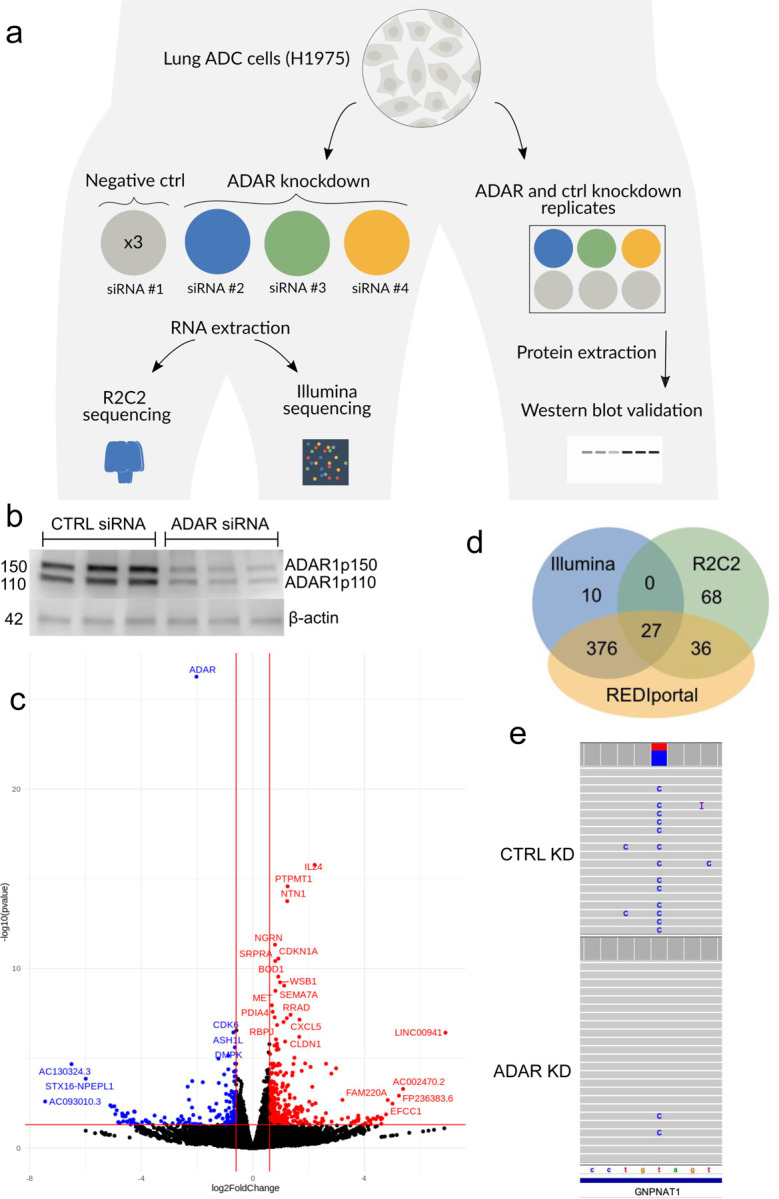
Figure 2 |. Identification of downregulated inosines with short- and long-read RNA-Seq.

a, Experimental workflow of ADAR knockdown in H1975 cells. b, Western blot validation of ADAR knockdown. c, Volcano plot of differentially expressed genes identified from Illumina sequencing. Red: genes with increased expressed after ADAR knockdown; blue: genes whose expression went down; black: no change in expression. d, Venn diagram comparison of the significantly downregulated inosines identified with Illumina, R2C2 nanopore, or present in the REDIportal database (hg38 liftover). e, IGV browser view of a downregulated inosine at chr14:52775760 in GNPNAT1 in the R2C2 data.
