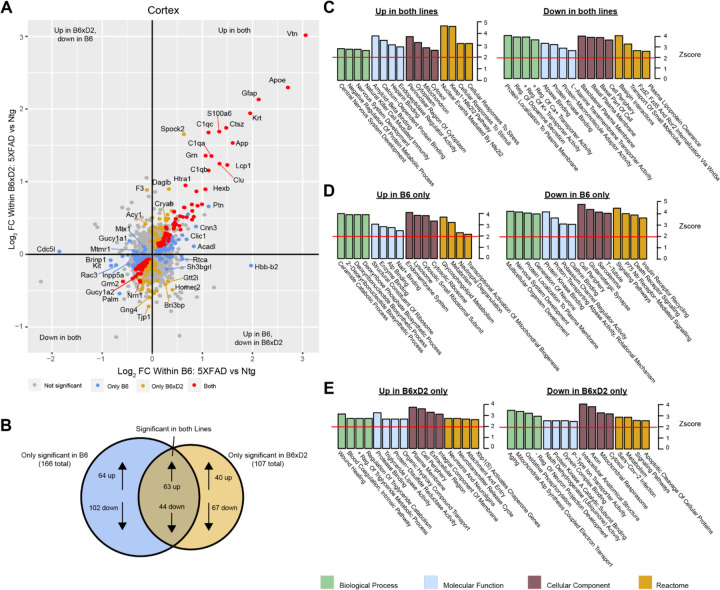
Figure 3: Differential protein abundance driven by genetic background and AD genotype.
A) Comparison of differential protein abundance between 5XFAD and Ntg mice on either the B6 or B6xD2 genetic background in cortex. One-way ANOVA with Tukey post-hoc correction was used to generate p-values (significance was determined as p<0.05). Log2 fold change (FC) differences were plotted to incorporate directionality of change on each genetic background. Color scheme: gray, not significantly changed; red, significantly changed in both B6 and B6xD2; gold, significantly changed only in B6xD2; blue, significantly changed only in B6.
B) Venn diagram representing overlap of significantly differential abundant proteins comparing 5XFAD with Ntg on either the B6 or B6xD2 genetic backgrounds (significance was determined as p<0.05).
C-E) Gene ontology analysis of protein subsets significantly increased or decreased on both lines (C) or on only B6 (D) or only B6xD2 (E) lines. Ontology analysis was performed for biological process, molecular function, cellular component, and reactome. A Z-score of 1.96 or higher is considered significant (red line, p<0.05).

