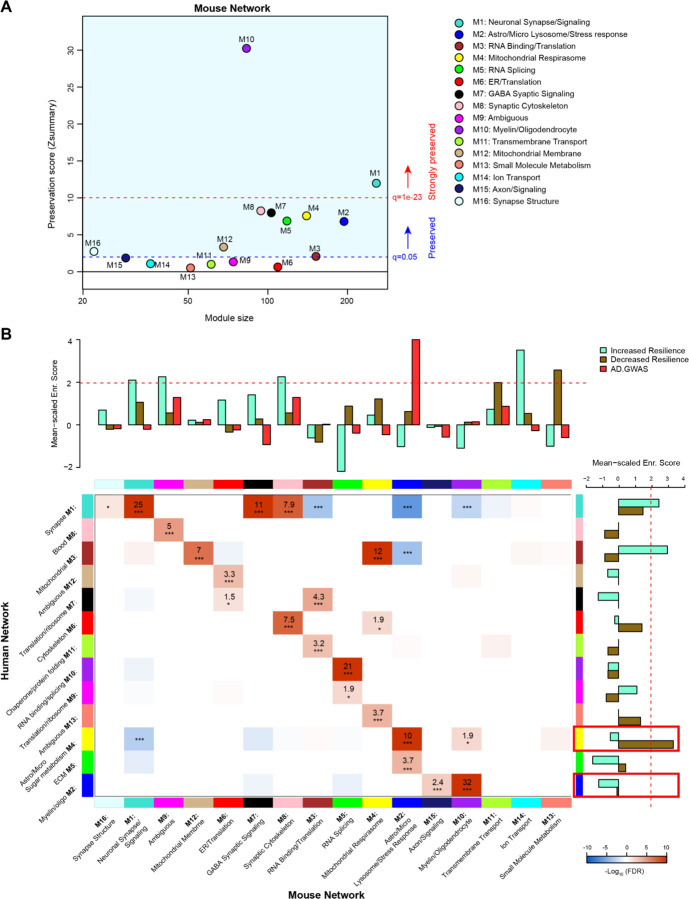
Figure 5: Comparison of 5XFAD mouse and human AD brain proteomic networks.
A) Network preservation of mouse protein network modules in a human AD frontal cortex network as published in Johnson et al. (16). Modules with Zsummary greater than or equal to 1.96 (q=0.05, dashed blue line) are considered preserved, and modules with Zsummary of 10 or higher (q=1e-23, dashed red line) are considered highly preserved. The majority (10 out of 16) of consensus modules from the mouse proteome were found to be preserved in the human network.
B) Heatmap for the overrepresentation analysis (ORA) of mouse consensus module members with human frontal cortex module members. Red indicates overrepresentation, blue indicates underrepresentation. Numbers in boxes are −log10 FDR values. P *<0.05, **<0.01, ***<0.001. Heatmap threshold is set at 10% FDR (0.1). Bar plots in heatmap margins show enrichment of proteins identified from GWAS of AD risk (red) or PWAS of cognitive resilience for both increased resilience (teal) or decreased resilience (olive) for mouse and human network module members. Dashed red line (z-score 1.96 or FDR q=<0.05) indicates significance cutoff. Red boxes in human enrichment bar plot indicate previously identified significantly enriched modules for AD GWAS proteins.

