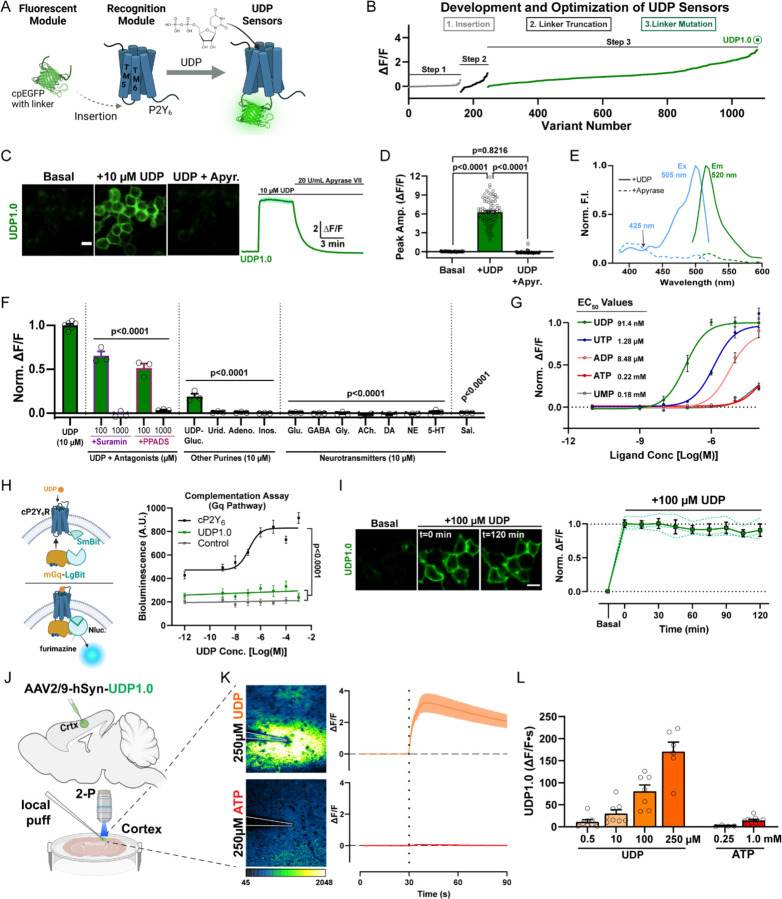
Figure 1: Development of a fluorescent sensor for in vivo imaging of extracellular UDP.
(A) To engineer the UDP biosensor, a circularly permutated enhanced GFP (cpEGFP) molecule with linker sequences was inserted into the extracellular loop between transmembrane (TM) 5 and 6 of the chicken P2Y6 (cP2Y6) receptor. (B) Optimization of the UDP sensor occurred through a three-step process including insertion site variation, N- and C-terminal linker truncation, and point-mutation-based optimization of the linker sequence, yielding the UDP1.0 variant (see Figures S3A, S3B). (C) Representative images and corresponding ∆F/F trace from HEK293T cells expressing UDP1.0 under basal conditions, after the addition of 10 µM UDP, and then after 20 U/mL apyrase grade VII (apyr.) treatment. Scale bar, 20 µm. (D) Summary of peak UDP1.0 ∆F/F amplitude under basal, UDP, or UDP plus apyrase conditions. One-Way ANOVA with Tukey’s post-hoc test (n=90 total cellular ROIs). (E) One-photon excitation (Ex) and emission (Em) spectra for UDP1.0 in the presence of 10 µM UDP (solid lines), or 5 U/mL apyrase (dashed lines). (F and G) Selectivity of UDP1.0. (F) Comparison of UDP responses in the presence of non-selective P2Y receptor antagonists, or other purine agonists, neurotransmitters, and saline. Peak ∆F/F responses were normalized to UDP. One-Way ANOVA with post-hoc UDP comparison. (G) UDP1.0 fluorescent response curves to purinergic ligands with EC50 values, see Star Methods for fitting (n=3–6 wells; 300–500 cells per well). (H) Wild-type cP2Y6, but not UDP1.0, drives Gαq signaling measured using a luciferase complementation assay. Left, schematic of the complementation assay. Right, total luminescence emitted by cells co-transfected with LgBit-mGq alone (control), or LgBit-mGq with cP2Y6-SmBit, or UDP1.0-SmBit, plotted against UDP concentration. One-Way ANOVA with Tukey’s post-hoc test (UDP1.0 vs. Control: p=0.3406; n=3 wells/group). (I) UDP1.0 fluorescence in HEK cells under basal conditions or with 100 µM UDP incubation for up to 2 hours. One-Way ANOVA with post-hoc comparison to the start of UDP incubation: P≥0.8934. Scale bar, 10 µm. (solid line: mean ± SEM; dashed line: one of three wells containing 300–500 cells). (J-L) Characterization of UDP1.0 in acute brain slice. (J) Schematic illustration of the slice experiments. An AAV2/9 expressing hSyn-UDP1.0 was injected into the cortex; 3 weeks later, acute brain slices were prepared and used for two-photon imaging. (K) UDP1.0 fluorescent responses to 250 µM UDP or 250 µM ATP. Left: example image showing the UDP1.0 response to UDP or ATP. Right: overall ∆F/F mean ± SEM response from n=4–6 trials. (L) Summary data showing the response of UDP1.0 to different UDP or ATP concentration in brain slice. UDP1.0 responses were calculated by the area under the curve shown in (K) over a 60s period. Summary data are presented as the mean ± SEM from 4–8 independent trials and N=3–4 slices.

