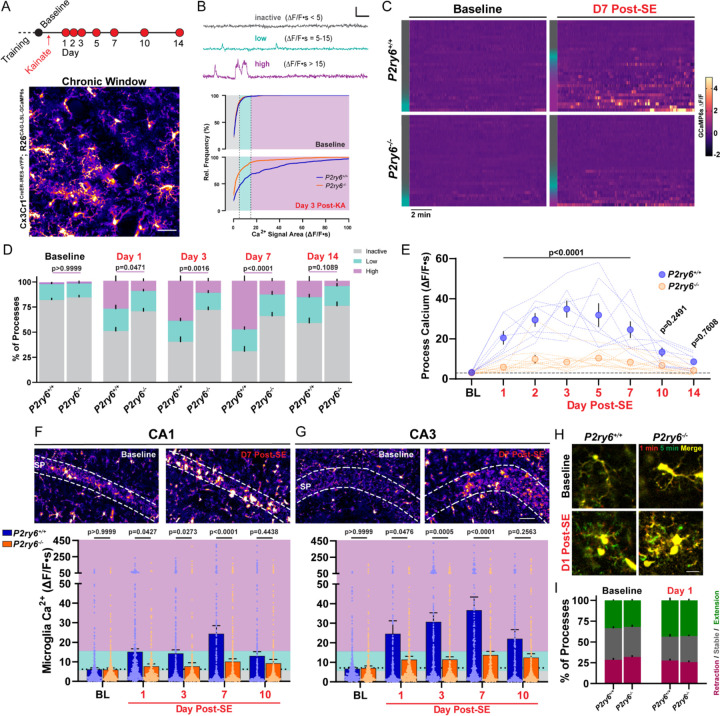
Figure 3: Microglial calcium elevations during epileptogenesis are P2Y6 dependent.
(A) Experimental timeline for in vivo, longitudinal calcium imaging of cortical microglia. Representative field of view. Scale bar, 40µm. (B) (Top) Examples of inactive, low, and high-level microglial calcium signaling used for segmenting activity. Scale bar: 1-fold ∆F/F and 60s. (Bottom) Microglial calcium activity distributions (∆F/F∙s) at baseline and 3 days after KA-SE. (C) Heatmaps of microglial GCaMP6s calcium activity (∆F/F) by genotype and time period (30 ROIs chosen to match inactive/low/high activity distributions—left color bar). (D) Percentage of total microglia ROIs exhibiting no, low, or high activity between genotypes and across periods of epileptogenesis. Two-way ANOVA with Sidak’s post-hoc test between activity levels (P-value compares high-level activity). (E) Overall calcium activity in P2ry6+/+ and P2ry6−/− microglia across two weeks of epileptogenesis. Two-way ANOVA with Sidak’s post-hoc test (dotted lines represent a longitudinal imaging region; dots represent group mean ± SEM). (F) (Top) 2P images of microglia in the CA1 region from acute brain slice. (Bottom) Spontaneous calcium activity in CA1 microglia across epileptogenesis. Two-Way ANOVA with Sidak’s post-hoc test (dots represent one ROI; survey of 2 slices per mouse; N=4 mice per time point and genotype). (G) As in (F), for microglia of the CA3 region. Scale bar, 50 µm. (H) In vivo average intensity images of microglia (overlay of start vs. 5 min) to indicate process motility. Scale bar, 15µm. (I) Overall percentage of microglial processes that extend outward, remain stable, or retract during in vivo imaging. Two-way ANOVA with Sidak’s post-hoc test: no significant motility differences between genotypes (p=0.5505–0.9965 by motility type). Bars represent the mean ± SEM. In vivo (A-E): N=4 P2ry6+/+mice, N=6 P2ry6−/− mice with 2 non-overlapping regions surveyed per mouse.

