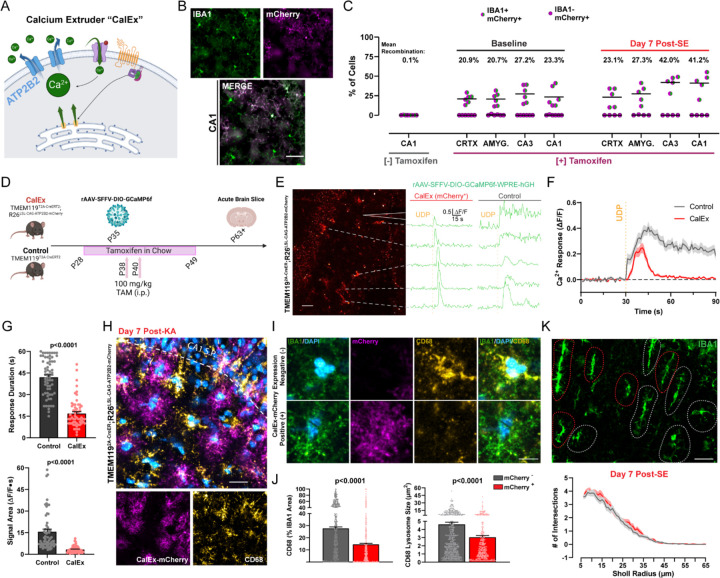
Figure 5: Attenuating calcium signaling through CalEx phenocopies lysosome impairments in microglia.
(A) Illustration of ATP2B2 calcium extruder (“CalEx”) function. (B) Images of CalEx-mCherry recombination against an IBA1 co-stain in TMEM1192A-CreER;R26LSL-CAG-ATP2B2-mCherry mice treated with tamoxifen. Scale bar, 30 µm. (C) Quantification of mean recombination by region (dot: one mouse; N=5–6 mice per group). (D) Outline of experimental steps to validate CalEx function in microglia. (E) Example of mCherry fluorescence in an acute brain slice with corresponding ∆F/F calcium responses following 500 µM focal UDP application (“CalEx” tissue). Scale bar, 40 µm. Right ∆F/F traces: example UDP calcium responses in an acute slice prepared from the control mouse line. (F) Overall calcium response (∆F/F) to UDP application (lines represent the mean ± SEM; aggregate of n=69 responding cells in Control tissue and n=59 responding cells in CalEx tissue; survey of 2–4 slices from N=4–5 mice per group). (G) Quantification of 500 µM UDP calcium response duration, and signal area between Control and CalEx microglia. Student’s T-test (dot: one cell; n=69 control cells and n=59 CalEx-mCherry cells; 2–4 slices from N=4–5 mice/group). (H) Representative image of CalEx-mCherry and CD68 expression in CA1 SR one week after KA-SE. Scale bar, 25 µm. (I) Closer evaluation of IBA1 and CD68 expression in a representative mCherry+ and mCherry− cell from (D). Scale bar, 7 µm. (J) Quantification of average lysosome size and overall CD68 area (normalized to IBA1 area) for mCherry+ and mCherry− cells. Student’s T-test (dot: one cell; survey of n=412 mCherry+ microglia and n=568 mCherry− microglia in CA1 SR from N=5 mice/group). (K) IBA1 morphology in CA1 SR with red and gray outlines denoting mCherry+ and mCherry− cells, established from the mCherry channel. Scale bar, 20 µm. Sholl plots for mCherry+ and mCherry− cells one week after KA-SE (n=88 mCherry+ and n=103 mCherry− cells from N=5 mice/group). Bar or line graphs display the mean ± SEM.

