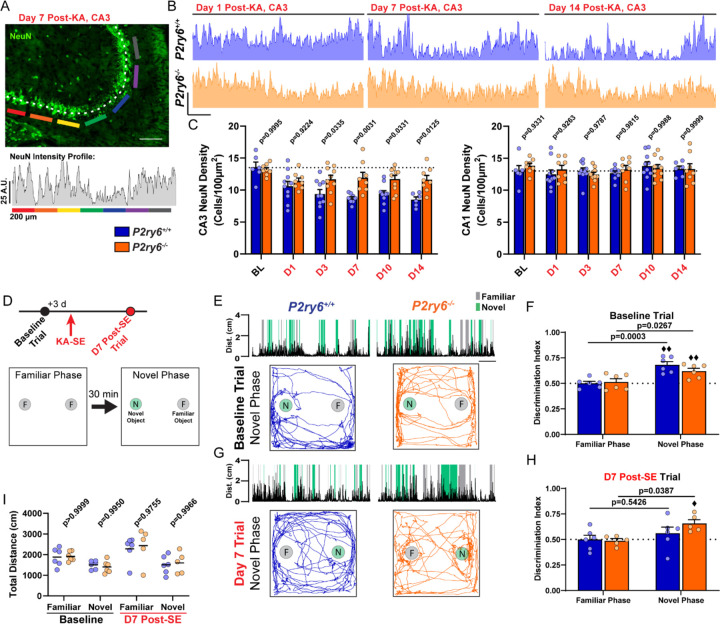
Figure 7: P2Y6 KO mice have improved CA3 neuronal survival and enhanced cognitive task performance.
(A) Example of a NeuN intensity plot from day 7 post-SE WT tissue. Scale bar, 200 µm. (B) Representative NeuN intensity profiles from the CA3 region of P2ry6+/+ and P2ry6−/− tissue. Scale bar, 25 A.U. and 200 µm. (C) Quantification of NeuN cell density in the CA3 or CA1 pyramidal band. Two-way ANOVA with Sidak’s post-hoc test (dots: one region; bilateral survey from N=3–5 mice/group). (D) Timeline of Novel Object Recognition (NOR) task (repeated at baseline and day 7 post-SE). Outline of the task procedure. (E) Representative trial performance in the novel phase during the baseline (naïve) test. (Top) Distance moved with periods highlighted during novel or familiar object interaction. Scale bar, 1 min. (Bottom) Trace of mouse movement in the arena. (F) Discrimination index score by genotype and trial phase during the baseline (naïve) test. Two-Way ANOVA with Sidak’s post-hoc test between familiar and novel phase performance by genotype (dot: one mouse; ♦♦P<0.01, one-sample T-test comparison to chance: 0.50). (G) As in (E), representative trial performance 7 days after KA-SE. (H) As in (F), discrimination index 7 days after KA-SE. Two-Way ANOVA with Sidak’s post-hoc test between familiar and novel phase performance by genotype (dot: one mouse; ♦P<0.05, one-sample T-test comparison to chance). (I) Total distance moved by trial phase. Two-Way ANOVA with Sidak’s post-hoc test (dot: one mouse). P2ry6+/+ and P2ry6−/− mice used longitudinally at baseline and day 7 post-SE (N=6 mice/group at baseline; N=6/6 surviving P2ry6+/+; N=5/6 surviving P2ry6−/− at day 7 post-SE).

