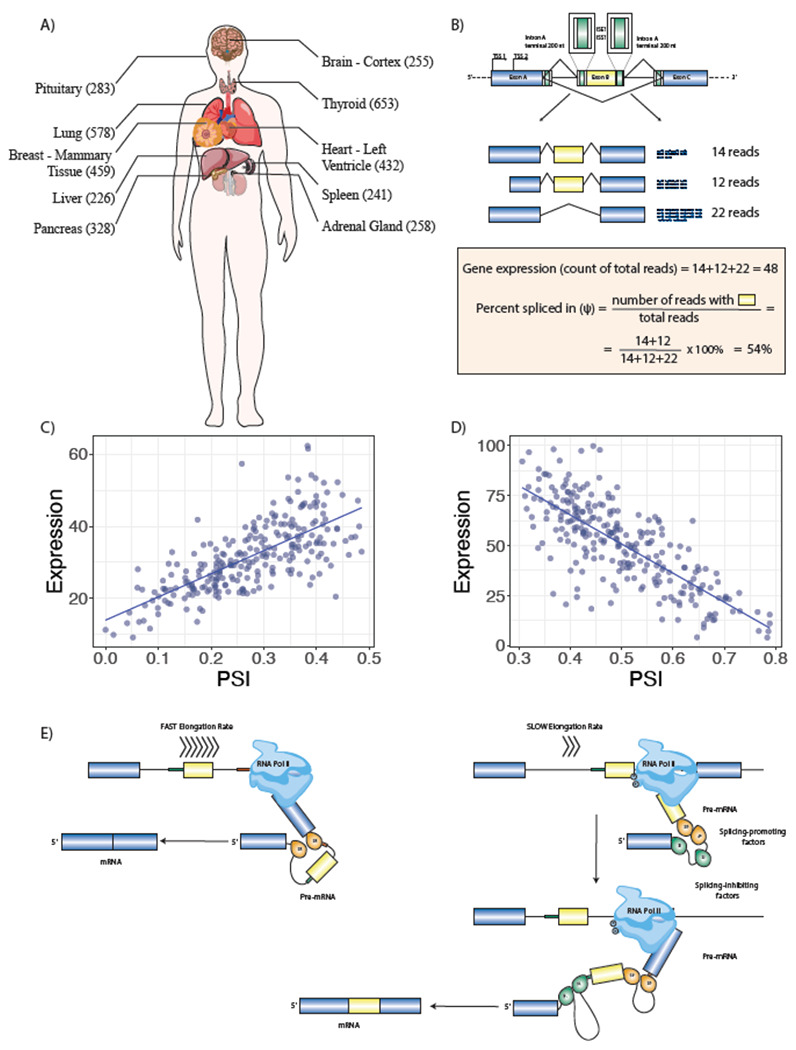
Figure 1. Multitissue RNA-seq Analysis Identifies Association between Gene Expression and Alternative Splicing.

A) RNA-seq samples from 10 tissues with the largest number of samples were analyzed. B) For each of 141,043 alternative splicing events with above-threshold variability in the ten tissues, total gene expression and percent-spliced in (ψ) were calculated and logistic regression was performed to test the association of gene expression and ψ. The cartoon at the top shows the regions of the introns surrounding the cassette exon that were investigated bioinformatically. C) 3,667 UHP (for “upregulated-high ψ”) exons with a statistically significant positive association were identified (ψ increases as total gene expression increases). One example is shown, exon 2 of ABI2. D) 3,207 DHP (for “downregulated-high ψ”) exons with a statistically significant negative association were identified (ψ decreases as total gene expression increases). In the example, exon 4 of ABLIM2 is shown. E) We hypothesized that our observations are related to mechanisms including coupling of RNAP2 extension speed with splicing decisions. In this example, a relatively fast RNAP2 elongation rate exposes a regulatory element (red box) at the 3’ end of intron B, which promotes skipping of exon B (left); in contract, slower RNAP2 elongation fails to expose this element for a period of time sufficient for the splicing machinery to include exon B. This is one of many mechanisms that link transcription and alternative splicing.
