
Figure 3. UHP/DHP exons and RNAP2 profiles.
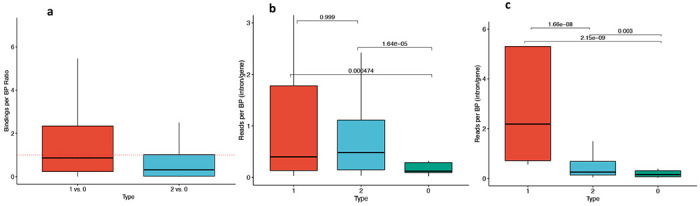
a) Relative RNAP binding to UHP/DHP exons vs. type 0 on the same gene. The data was obtained from POLR2A peaks over 106 ChIP-Seq experiments. Outliers were removed to limit the y-axis range. b,c) The ratio between PRO-Seq reads per base pair in downstream introns UHP, DHP, or type 0 exons and the sum of these values for the corresponding gene, for every UHP, DHP, or type 0 exon, from the Wissink et al. dataset (b) (45) and the Gupta et al. dataset (c) (46). Outliers were removed to limit the y-axis range. The mean values for UHP/DHP exons are significantly larger than type 0, suggesting a longer processing time of that section of the nascent mRNA.