
Extended Data Fig. 10. Integrative structure modeling of the full-length Pks13 dimer.
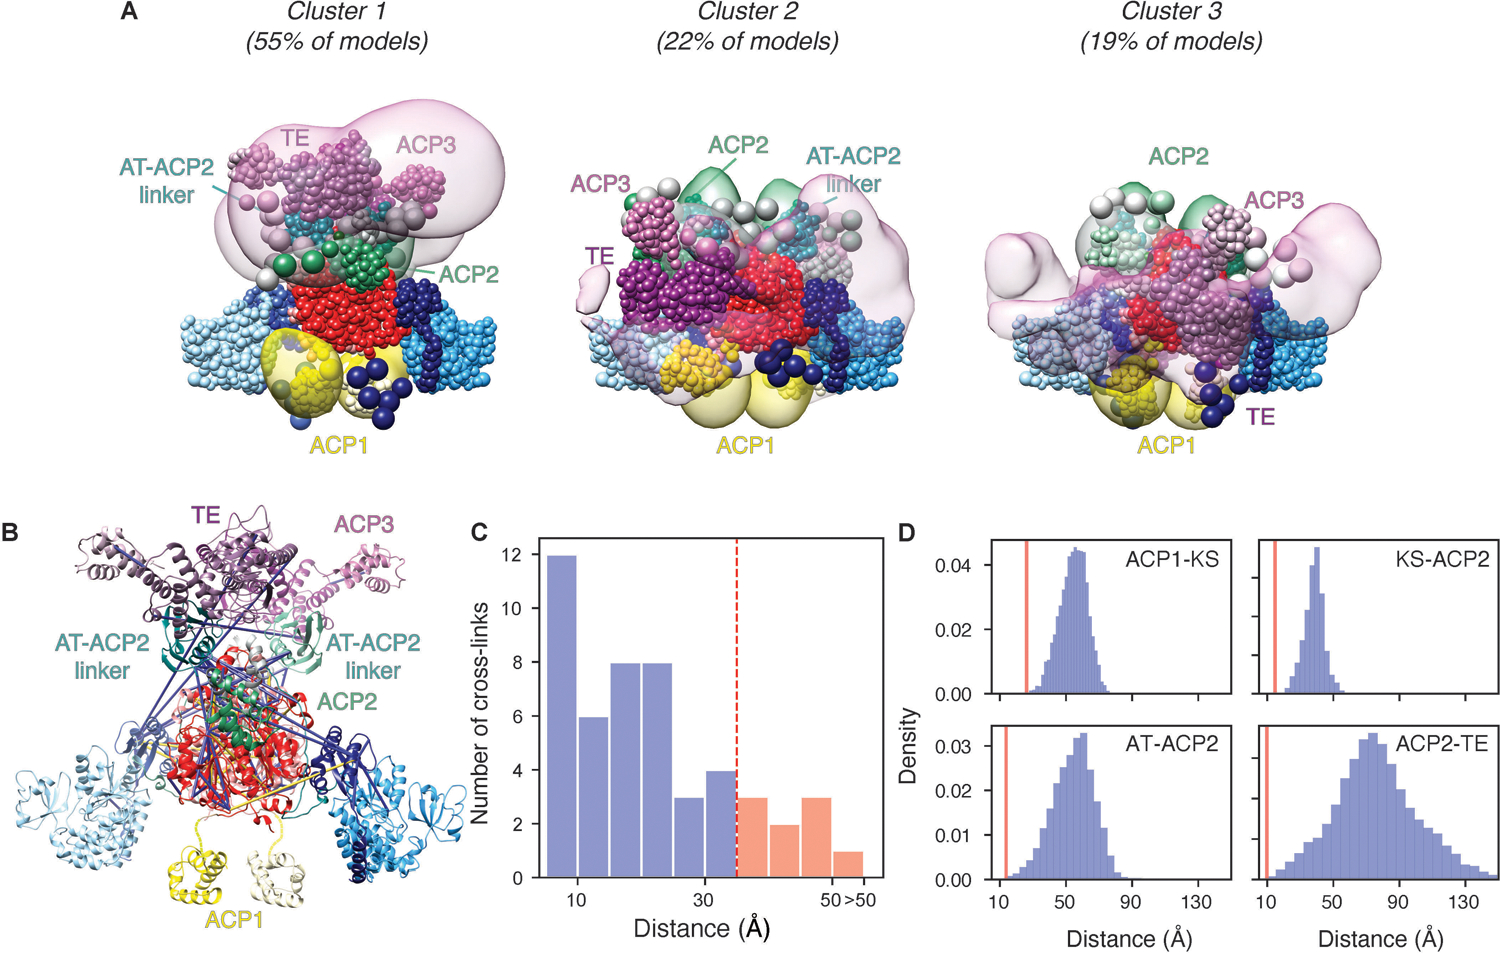
(A) The localization probability density of the ensemble of structures is shown with representative (centroid) structure from the ensemble embedded within it. The three panels represent different solutions with their relative percentages listed above. The structured and unstructured regions are represented as beads, using the same color scheme as Fig 1A. Regions with well-defined structures are modeled as rigid bodies consisting of beads representing each individual residue; the coordinates of a 1-residue bead were those of the corresponding Cα atom and represented. Regions with no available structure or flexible regions are represented as flexible strings of beads, corresponding to up to 10 residues per bead. (B) Detail of cross-links mapped to the centroid structure of the integrative model of the Pks13 dimer. Satisfied and violated cross-links shown in blue and yellow, respectively. A cross-link is classified as satisfied if the Cα–Cα distance spanned by the cross-linked residues in any of the models of the cluster is less than 35 Å. (C) Histogram showing the distribution of the cross-linked Cα–Cα distances in the Pks13 dimer integrative structures. (D) Histogram showing the Cα–Cα distances between the active sites of the ACP1-KS, AT-ACP2, KS-ACP2, and ACP2-TE domains. The shortest distances (red lines) are 26, 13.7, 14.8, and 9.7 Å between the ACP1-KS, AT-ACP2, KS-ACP2, and ACP2-TE domains, respectively.