
Fig 3. Map-to-model FSCs, and example EM densities.
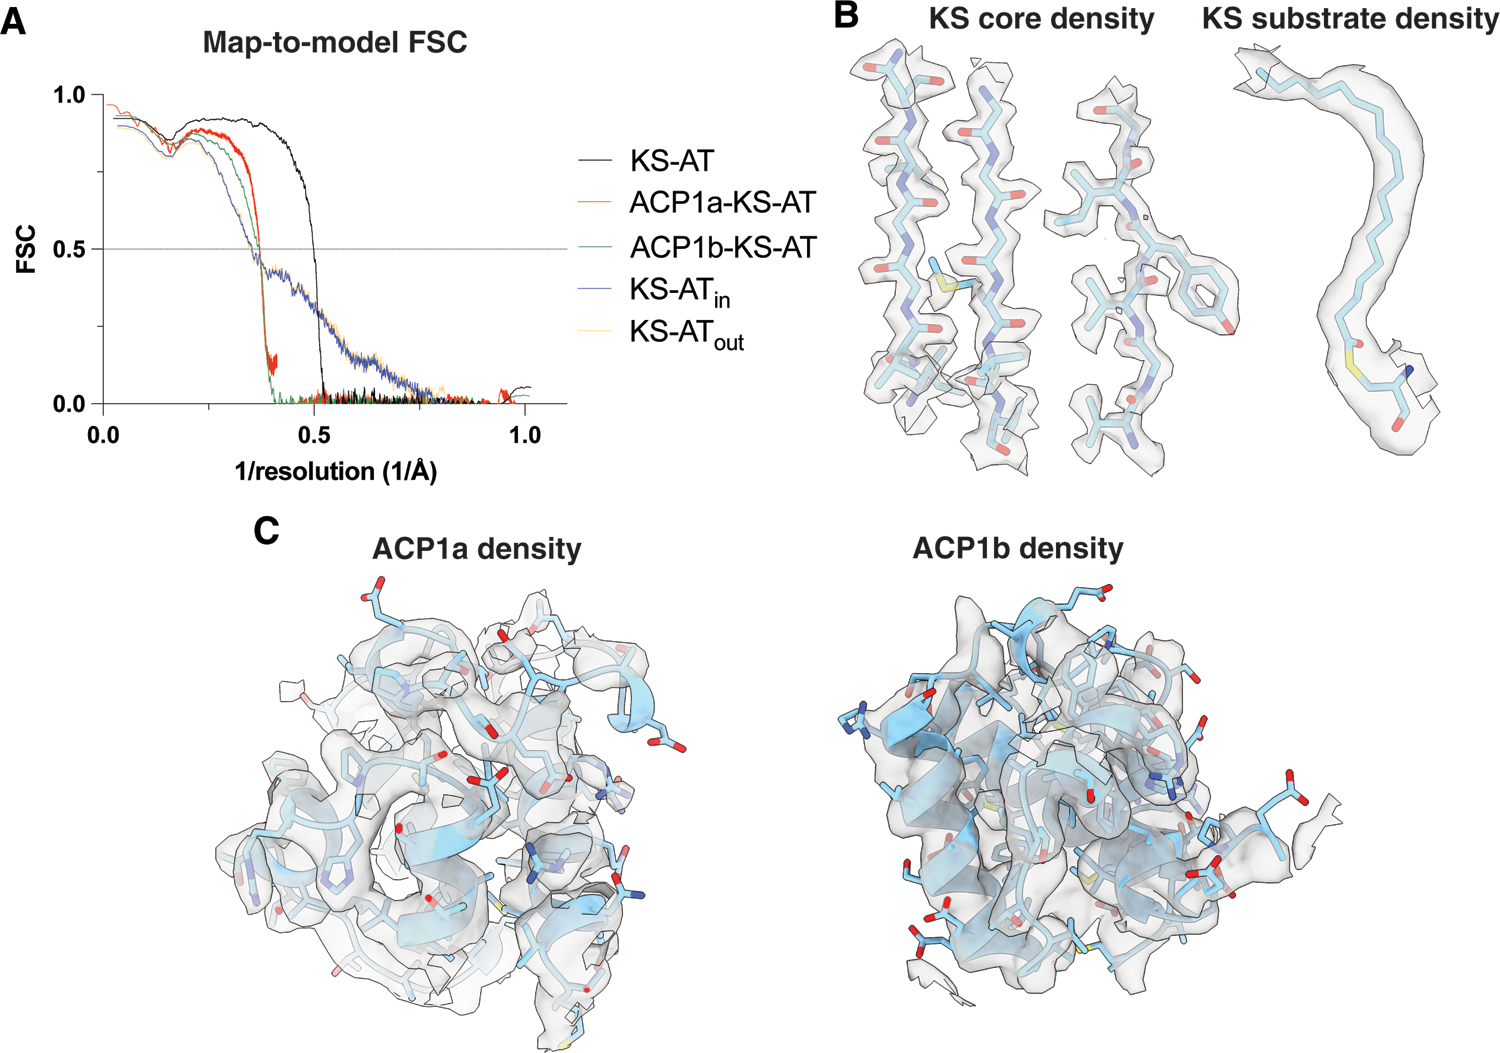
(A) Map-to-model FSC curves for all the structures described from consensus refinement and focused classifications and refinements. (B) Near-atomic resolution density in the KS core. Beta strands are shown (left) and lipid density extending upward from the KS active center C267 (right). (C) Density for ACP1a (left) and ACP1b (right).