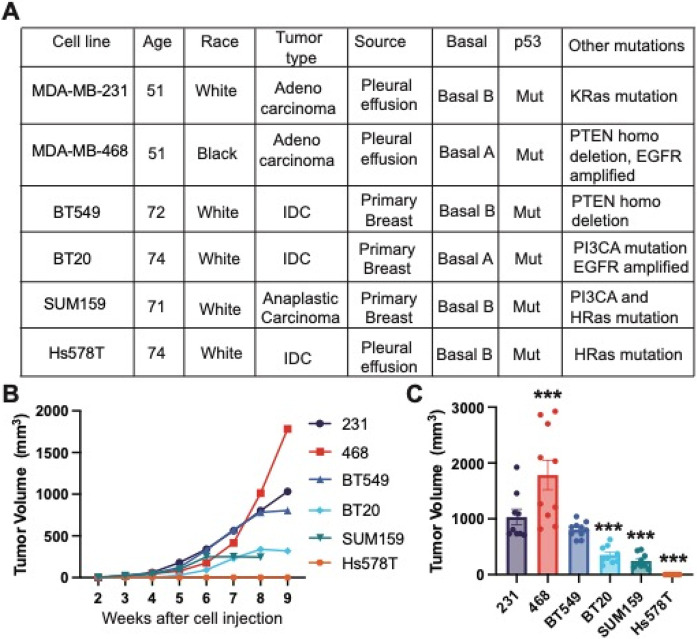
Figure 1. Tumor growth of human TNBC cell xenografts implanted in immunocompromised female NOD-SCID mice.
(A) Characteristics of six human TNBC cell lines used in the study. M, mutant; WT, wild type; Mes, Mesenchymal; Bas, Basal; IDC, invasive ductal carcinoma; (B) Tumor volume over time for each cell line 231, 468, BT549, Hs578T, BT20, and SUM159. (C) Tumor volume at the terminal endpoint. Data are shown as mean with SEM, n = 8-10 animals/group. Significance relative to 231 was determined using a one-way ANOVA with Dunnett’s multiple comparisons tests, *p<0.05, ** p<0.01, *** p<0.005.

