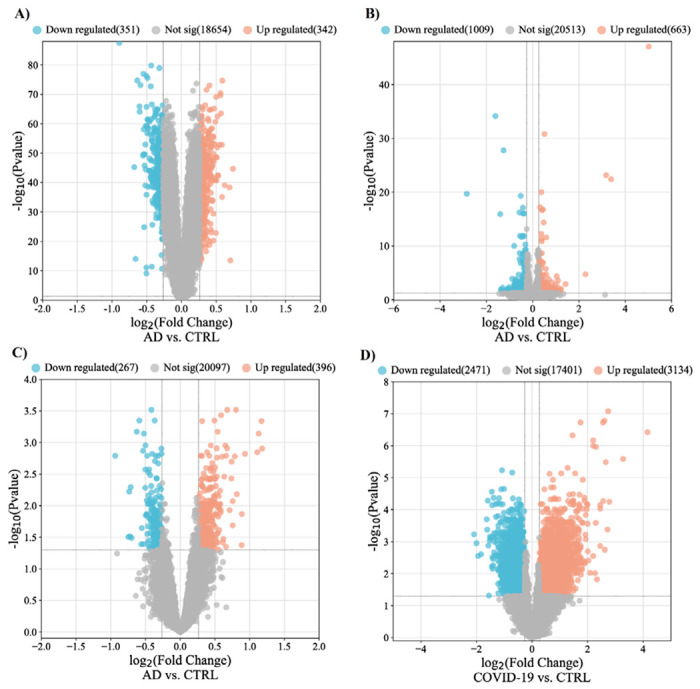
Figure 1. Differentially expressed genes from each datasets.

Volcano plots demonstrate the thresholds for differentially expressed genes in GSE33000 (A), GSE 48350 (B), GSE118553, and GSE188847. Each data point represents a single gene. The x-axis represents the log2 fold change in expression (AD or COVID-19 vs. Control), and the −log (p-value) is plotted on the y-axis. Blue and red points indicate significantly (p-value < 0.05) down- and up-regulated genes with fold change lower than 0.83 and over 1.2. AD, Alzheimer’s disease; CTRL, Control; FC, Fold change.
