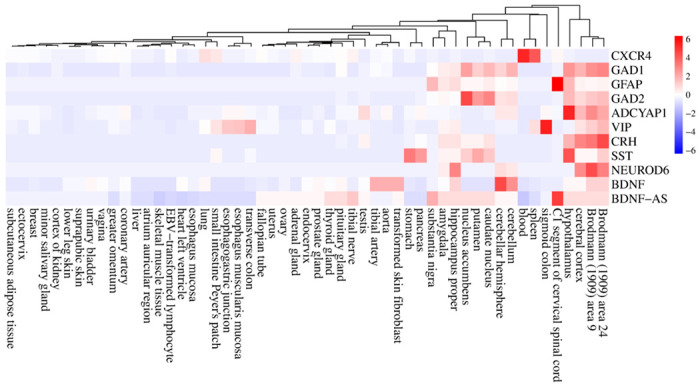
Figure 4. The tissue-specific expression of hub genes.

The heatmap show the expression levels of the hub genes in different human tissues based on the GTEx database. Expression levels are normalized using the Z-score normalization method.

The heatmap show the expression levels of the hub genes in different human tissues based on the GTEx database. Expression levels are normalized using the Z-score normalization method.