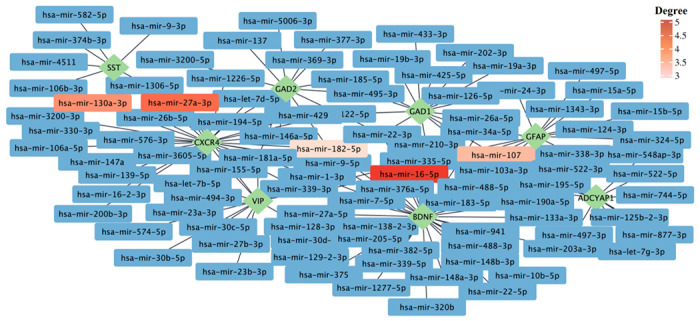
Figure 7. The gene–miRNA interactions network.

The gene–miRNA interactions network is generated by using the TarBase database. The green rhombi show the hub genes, and the rectangles show the miRNA interacting with hub genes. The top five miRNAs based on their degrees are highlighted. The complete list of miRNAs interacting with hub genes can be found in Supplementary file 1.
