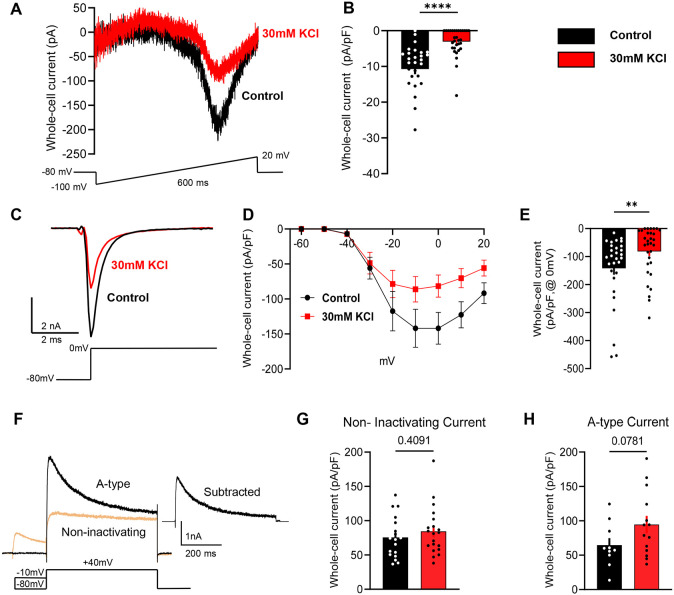
Figure 6: Sustained depolarization of mouse DRG neurons inhibits voltage-gated sodium channel currents.
A) Example traces of voltage-gated sodium currents from control-treated cells (black) and KCl-treated cells (red) using a voltage-ramp protocol shown below traces. Cells were held at −80 mv, and ramped from −100 to +20 mV for 600 ms. B) Statistical analysis of control cells (black, n=28) versus KCl-treated cells (red, n=31). C) Example traces of voltage-gated sodium currents from control-treated cells using a voltage-step pulse protocol shown below traces. D) I/V curve of voltage-gated sodium currents from control and KCl-treated cells. Cells were held −80 mV and a series of step pulses ranging from −60 to +20 mV were applied in +10 mV increments for 1s. E) Current density analysis of control cells (black, n=29) versus KCl-treated cells (red, n=31) at 0mV. F) Example traces of A-type and non-inactivating voltage-gated potassium currents in mouse DRG neurons using a voltage-step pulse protocol shown below traces. Cells were clamped at −70 mV and conditioning prepulses ranging from −120 to +40 mV were applied in +10 mV increments for 150 ms every 5s followed by a pulse step of +40 mV for 500 ms. The isolation protocol of A-type voltage-gated potassium currents is shown below the representative traces. G-H) Current density analysis of A-type currents and non-inactivating currents (control-black, KCl–red). Statistical significance was calculated with the Mann-Whitney test or unpaired t-test. Scatter plots and mean ± SEM for current amplitudes. *p<0.05, **p<0.01, ***p<0.001, ****p<0.0001. Data are represented as mean ± SEM

